
We write and talk a lot about return asymmetry (aka convexity). Please see here, here, here, or here. Or for a primer of sorts on the topic, please see here.
We discuss the topic most heavily in MBS and long-duration space, and sometimes in munis. But sneakily, the convexity profile of the front-end corporate market has changed vastly in the last 10 years, and it has not been to the advantage of bondholders. Interestingly, it doesn’t really show up on paper.
The convexity of the Bloomberg Barclays 1-5 Year Investment Grade Corporate Index has narrowly changed on paper over the last decade[1], falling from 0.10 units to 0.06 units. Some might say that is a 40% reduction, but the law of small numbers can be misleading. Remember this one? To translate this decade-long change into portfolio performance, it means that for a 100bp change in interest rates, the value of the convexity insurance (since it is positive) has fallen by 2bps, which is rather immaterial. But underneath this de minimis number, a convexity monster is lurking.
A “few” fun facts on the change over the last decade[1]:
- The market value of the index has nearly doubled, growing from $1.2 trillion to $2.2 trillion.
- There are 586 unique issuers represented in the index, which is up from 456.
- The top 10 issuers now account for 19.8% of the index value, which is more diversified than the 25.8% a decade ago.
- Three of the 10 largest issuers today were not in the index 10 years ago – AAPL, GM, and ABBV.
- GE saw the largest reduction in representation, falling from 3.5% of the index to 0.3%, as index-eligible front-end debt load went from $40.8 billion to $7.3 billion.
- AT&T has fallen from 1.51% of the index to 0.68%, while total debt outstanding has climbed from $67 billion to $205 billion. This reflects the increase in longer debt and concurrent tendering for front-end bonds that has occurred during this time. Some good notes on increased tender activity are here.
- Baa allocation in the index has grown from 26% to 46%.
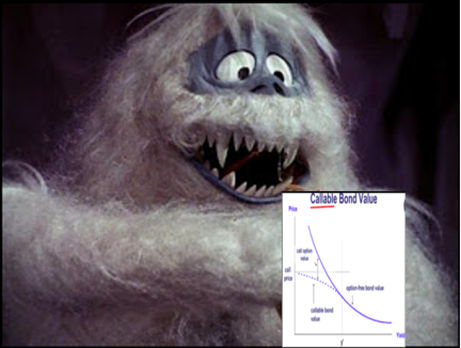
- Callable bonds in the index have climbed from 13.2% to 60.2%.
We want to expand on that last point. Investors have been increasingly willing to sell an option to issuers despite lower risk compensation and higher volatility[2]. These factors, coupled together, are especially concerning as the value of the option sold increases in value with higher volatility. However, investors have become more willing to accept a lower price despite this greater intrinsic value. Risk compensation has fallen as it would be formulated as the value of risk compensation on a non-callable bond less the value of the option sold. The former has declined, while the latter has increased – both of which are adverse for the investor.
The uptick in callable issuance started with “liquidity” calls, especially within the industrial space. These typically had short call windows of about three months prior to maturity. Some market participants term these “nuisance calls,” but we don’t like the expression because it downplays the option value, which can be important during times of high volatility. Many of the larger banks then began issuing TLAC (Total Loss Absorbing Capacity) related debt to better optimize regulatory treatment of their balance sheets. These structures are typically fixed-to-float and are callable in the last year prior to maturity (the floating rate period). Capital treatment for outstanding bank bonds becomes less beneficial as bonds approach maturity, often losing half of their capital treatment two years prior to maturity and all the capital benefits in the last year. This regulatory treatment can create opportunities for investors, since the potential exists for non-interest rate-driven call decisions to occur. That is, if a bank calls the bonds to enhance capital treatment, but does so after a rise in rates, the investor stands to benefit as the economics of value creation are different here for the bank and investor.
Recently, there has been a rise in callable issuance with more negatively convex structures. Boeing, for example, has issued over $8 billion in debt this year between a 3NC1 (read as “3NonCall1” – matures in 3 years, callable in 1 year) and a 5NC2. AT&T has issued over $5 billion this year utilizing these same structures. The existing negative risk symmetry must be properly valued. The 5NC2, for example, will sell-off/underperform like a 5-year, and rally/outperform like a 2-year. While investors must remain cautious when selling an ever-more lucrative option, opportunities can exist in these structures, and some clients might have seen such securities appear in the portfolios we manage. The proper analysis here is critical, and several valuation methods must be utilized for effective bond management. OAS (option-adjusted spread) continues to be the gold standard (although it has some limitations), but must be used in conjunction with other valuation metrics, such as g-spread[3] to both call and maturity dates, quoted trading spreads (usually to the most closely matched on-the-run treasury), and overall credit trajectory views (positive credit momentum would suggest tighter future spreads all else equal and skew towards the call date; negative momentum would suggest wider spreads to come and make maturity-matching analysis more indicative of underlying value).
A post today about short-end convexity would not be complete without a discussion of make-whole calls. A make-whole call gives the issuer the option to redeem bonds at a predefined spread over a maturity-matched Treasury; this spread is typically around 10% of the new-issue spread. With the Bloomberg Barclays 1-5-year Investment Grade Corporate Index closing last month at an OAS of 41bps, make-whole call risk is much higher that it has been historically, as more bonds are trading at spreads inside the redemption level. If convexity is used to define the asymmetries that exist across various potential return profiles, few are as negative as buying a bond through its make-whole level. Being aware of this risk is especially important in today’s low spread environment.
The short end is evolving and becoming more complex. While it may not appear on paper, the underlying return asymmetries are certainly shifting beneath. We will continue to invest prudently and account for these changes. After all, convexity is a crucial part of the credit, structure, AND price framework. Expect to hear us speak of it more going forward as the structural factor must now be incorporated into front-end dialogue; it’s no longer just a mortgage and long-duration term. Beware of the convexity monster.***
***My assumption is the convexity monster looks like the Abominable Snow Monster from Rudolph. Similarly, once understood, the monster can be useful.
[1] Data as of 6/30/2011 – 6/30/2021
[2] Volatility as measured by swaptions. A 2×1 interest rate swap is a good measure for front-end volatility. Front-end swaption volatility, however, has limitations given exceptionally low short Treasury rates, as modest moves in basis points can have outsized impacts on movements quoted in percentage terms.
[3] G-spread is the bond’s yield less a maturity matched Treasury yield (Treasury curve will often be interpolated here to best-match the specific date). This can be especially helpful in the front end, where Treasury curves are steeper, and a large basis can exist between the Treasury used for quoting a traded spread and a Treasury that matches the take-out date(s). This analysis should reflect both the call and maturity dates, so a single number is insufficient here as it would ignore the negative convexity.