Lies, damned lies, and statistics – I still remember my undergraduate statistics professor saying this to us in our first class. It took me a while to fully appreciate the expression. I mean, how can numbers lie? We have probably all heard it a time or two over our careers, or had moments when we question the validity or sanctity of a certain set of numbers. Numbers are supposed to be the guiding principal to so many of the decisions we make. So what happens when a certain number loses its meaning? In this specific instance, I am talking about the coveted, frequently cited, golden-child of value declaration, The Muni/Treasury ratio, or simply The Ratio. I capitalize it out of respect to its long-standing stature in the municipal market. The Ratio is calculated by dividing the Aaa Muni Yield (the municipal market’s version of a near risk-free rate) by a Treasury of the same maturity.
Going back to the dawn of time, by which I mean the prevalence of municipal bonds in modern day investing, The Ratio has been the most common way to communicate the attractiveness of the municipal market relative to other asset classes. When the number is high, buy munis, when low sell (but be mindful of the tax bill from selling). Well, as rates have plummeted and the one year muni rate is inside of 20bps, the law of small numbers has taken a victim, The Ratio.
The 3yr Aaa muni rate is 26bps, and the same maturity Treasury rate is 16bps, producing a Muni/Treasury ratio of 163%. The average going back to the turn of the millennium is 98%, the median 81% (talk about a skew- the data is certainly not normally distributed) thus all signs point to Buy. With a 44% standard deviation, we are nearly 1.5σ cheap to long-term, heavily skewed, averages. The present ratio and the accompanying statistics would clearly indicate an attractive entry point into municipal bonds. While I will stop well-short of calling this a “damned lie,” we think it only conveys a small amount of the total relevant information.
As interest rates have dropped, looking at smaller and smaller numbers as a percentage of one another is becoming less meaningful. Take the Muni and Treasury numbers above. If a trader turned and yelled, “the ratio just fell 20%, munis are rallying,” it would elicit quite the response, but in reality, the Treasury rate may have just sold off by 2bps, which typically brings a rather muted reaction.
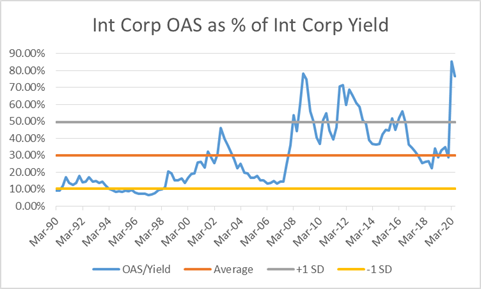
So as we mourn the loss of The Ratio’s relevance, we take solace in the fact there are much better, more applicable and holistic data points to use when discussing cross-sector relative value. One of the biggest flaws of The Ratio is it only compares two things – Aaa muni yields and Treasury yields. This begs the question, what about spreads? And as risk-free rates hover near all time-lows, spreads have become the more important component of the yield calculation. See below intermediate corporate spreads as a percent of the total yield.
Enter tax-equivalent spreads, or TES. Tax-equivalent spread is the spread needed on a taxable bond to produce the same yield as a municipal bond. The tax equivalent spread will vary based on the municipal bond chosen for comparison and the applicable tax rate – higher with climbing tax rates and vice versa. The equation for TES is TES = (Municipal Yield / (1 – Tax Rate)) – Treasury Rate. TES has the advantage of incorporating the spread component of yield across sectors. Take the 3yr muni rate above of 16bps and add to it 15bps for spread for a total yield of 31bps. Divide this by 1 minus the applicable tax rate, say 40.8% for the top marginal tax rate produces a tax-equivalent yield (TEY) of 52bps (remember that last post highlighting the decline in value of the exemption at low rates – here, it is worth only 21bps). Now if we subtract out the 3yr Treasury rate of 16bps, we get a TES of 36bps. Front-end Corporate OAS is presently 70bps, thus offering an attractive yield advantage over municipals, even at the top marginal tax rate. TES is more informative than TEY as taxable bonds are quoted in spreads when trading, not yields.
This is where I think it all becomes so interesting. The Ratio is clearly telling us to buy munis at 1.5 standard deviations cheap to history and well north of 100%, but TES is clearly suggesting corporates are the place to be. At IR+M, we always say to measure twice, cut once – it is one of our guiding principles of investing and a pillar of principal protection. Hopefully, this highlights just how important it is to measure twice, but also ensures you have the right unit of measurement. When offered contradictory relative value arguments, we favor the one that is more encompassing of all data points, not simply the one that has been most frequently cited. So as we discuss after-tax relative value over the coming quarters and years, expect to hear The Ratio cited less, and TES more. In closing, until rates (hopefully) rise in the future, I now claim The Ratio is Dead…Long Live The Ratio.