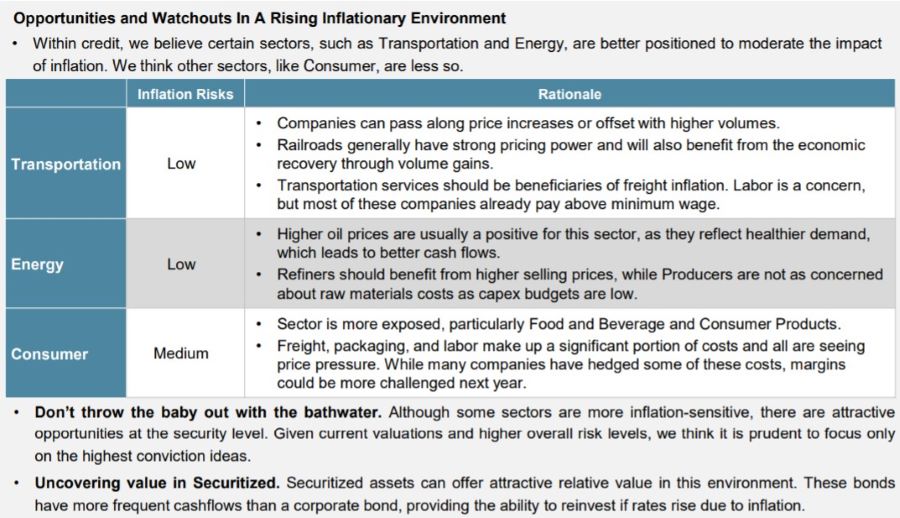
As the global economy continues to recover, an accommodative Federal Reserve (Fed) and stimulative fiscal policy have pushed inflation concerns to center stage. By some measures, inflation is at its highest in over a decade, and several factors could sustain these levels. Conversely, other metrics point to a more benign environment, and suggest the recent increase may be “transitory.” While we do not predict the future, we believe overall inflation risks are elevated, particularly given current spreads and valuations. In this piece, we focus on key inflation metrics, and identify which asset classes and sectors may be better positioned to handle the rising risks.
On a Scale of 1 to 10, How Much Does This Hurt?
- Inflation impacts different people differently. We all have anecdotes of higher prices, whether at the grocery store or gas station. Some will experience inflation considerably more, such as an individual looking to buy a house or a car. Companies also feel squeezed, with homebuilders paying as much as four times the price for lumber compared to a year ago, or retailers giving sign-on bonuses to attract employees. However, some are better hedged or able to pass along these costs to customers.
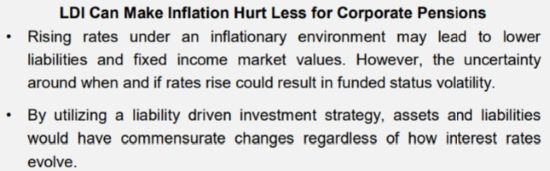
- The same is true at an institutional level. For example, with endowments, real returns may be negatively impacted by higher inflation, but they may also have flexibility to reduce spending. Pension plans, which may not have the flexibility to reduce benefits, might need to make additional contributions.
Measuring Inflation: The Devil Is In The Details
- Alphabet soup. There is no one way (or acronym) to measure inflation. While each method helps tell the story, Consumer Price Inflation (CPI) and Trimmed-Mean CPI are two key metrics that illustrate how results can differ based on the methodology.
- CPI, or headline CPI, measures the prices paid by consumers for a basket of goods and services,
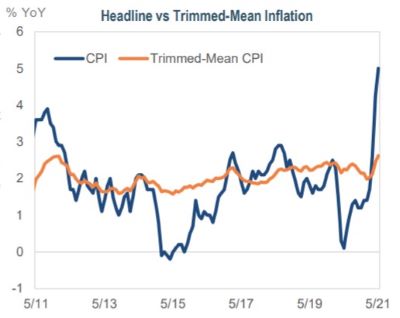 including food and energy, which are often more volatile. The recent jump in CPI has been fueled in part by supply chain bottlenecks. For example, used cars and trucks account for almost one-third of recent increases, which have been affected by the chip shortage.
 - Trimmed-Mean CPI¹ adjusts CPI to remove the items with the highest and lowest one-month price changes. By excluding the outliers, this metric can provide a better signal of the underlying trend.
- CPI, or headline CPI, measures the prices paid by consumers for a basket of goods and services,
- Both metrics show an increase in inflation. However, trimmed mean CPI has experienced a much smaller rise, which might indicate a more transitory jump than a sustained shift higher.
- Inflation expectations are important. The Fed watches real-time inflation data, but also factors expectations into their decisions. The Fed closely monitors breakeven inflation rates, which measure the difference in yields between nominal Treasuries and similar-maturity TIPS (Treasury Inflation-Protected Securities). Although breakevens have been on the rise, they recently fell as the Fed continues to emphasize the temporary nature of the current inflation spike.
Impact of Inflation Regimes on Different Asset Classes
- Based on history, trend inflation, defined as the 5-year rolling average of CPI, is at relatively low absolute levels. Asset classes respond differently when inflation is rising or falling relative to trend.
- Where are we now? Inflation was below trend going into 2020. However, since hitting a pandemic-low of 0.1% in May 2020, inflation has broadly moved higher. While base effects and supply chain bottlenecks have factored into recent CPI reports, the last two readings have been sharply above trend, which could have implications for asset returns.
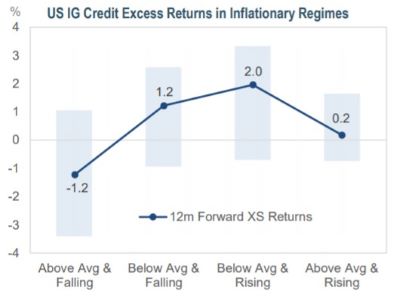
- Treasuries tend to perform worst in rising inflation environments, as higher inflation both reduces the value of cashflows and typically leads to higher interest rates.
- TIPS can offer protection against rising inflation. However, TIPS returns are more correlated to interest rates than changes in inflation. Additionally, TIPS look most attractive when deflation fears have pushed breakevens near zero, like last year. As inflation recovers, we see more relative value in spread product. See our blog post for additional information.
- Credit typically does best when inflation is below average and rising, which is generally an indicator of economic growth. However, too much inflation might be the result of an overheating economy, which can lead to diminished returns.
The Only Thing I Cannot Predict Is The Future
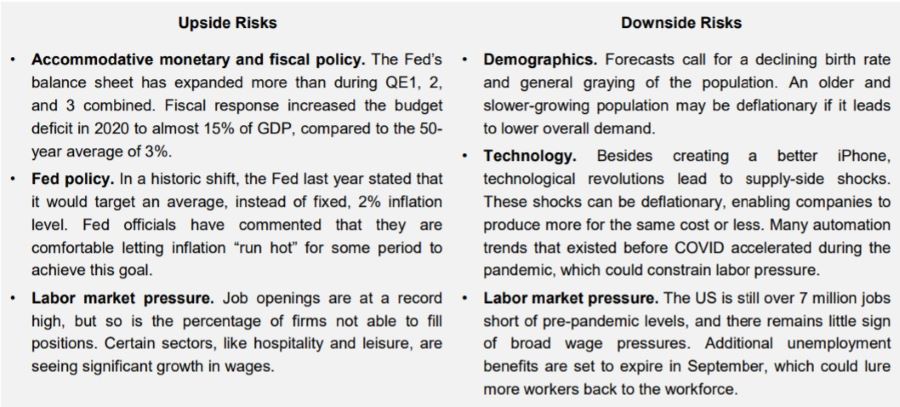
- Accurate forecasting is difficult. The number of scenarios that could lead to greater inflation have increased, and several factors may lead to a sustained higher level. This bout of inflation could also be temporary, as there are many structural elements that could keep levels low.
- Don’t go chasing waterfalls. Inflation is an important factor to consider when making decisions related to portfolio positioning. While we do have views on the potential direction of inflation, we remain duration-neutral and instead express these views through bottom-up security selection. We prefer to remain diversified and “take what the market gives us,” rather than position for a specific forecast.
At IR+M, we believe the risk of higher inflation, particularly in an environment of tighter spreads and high relative valuations, cannot be overlooked. However, we maintain that inflation is difficult to predict accurately and consistently, and as such, do not position for a specific target. We endeavor to create well-diversified portfolios and rely on our bottom-up security selection expertise to identify bonds that may be less susceptible to rising inflation. If inflation does lead to increased interest rates, fixed income investors stand to benefit due to the ability to reinvest at higher rates.