Twenty-two-time grand slam champion Rafael Nadal was upset in the fourth round of the US Open on Monday by American Frances Tiafoe, in a four-set match that lasted over three hours and thirty minutes. 24-year-old Maryland native Tiafoe is the son of immigrants from Sierra Leone; if you haven’t heard of him, Google it, as his story is amazing. After Wednesday’s win over Andrey Rublev, Tiafoe is the first American man to reach the semifinals at the Open since Andy Roddick in 2006. The financial markets also periodically face upsets, and like athletes, tend to be resilient over time.
The following timeline reviews the major market dislocations over the past 25 years. A relatively constant pattern emerges: the Federal Reserve (Fed) typically steps in, wider spreads and equity weakness creates buying opportunities, and markets recover. Moreover, we’ve found that during recoveries, bond availability is scarce, so averaging-in and picking your spots makes sense.
Chart 1: Stock & Bond Market Reactions to Disruptive Events (Shaded Areas)
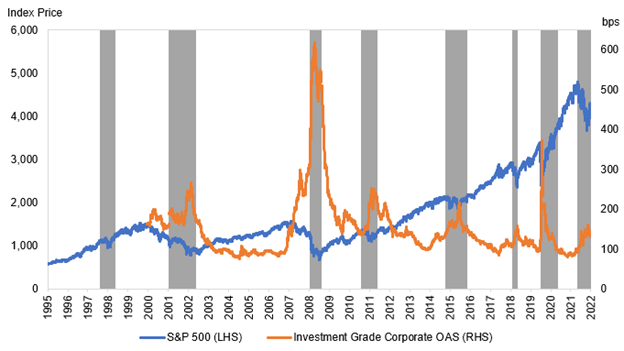
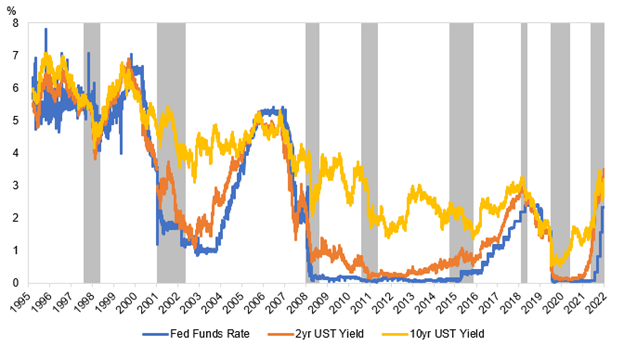
Chart 2: Rate Reactions to Disruptive Events (Shaded Areas)
Long-Term Capital Management (1998)
In 1998, a hedge fund run by highly credentialed people collapsed, primarily due to levered bets that imploded as the Asian financial crisis and Russian debt default evolved. This was one of the first large-scale intertwined panics involving the liquidation of highly levered positions and an intensified focus on liquidity. The NY Fed ultimately organized a $3.625 billion bailout and cut the federal funds rate (fed funds) three times over the course of two months.
Spreads widened ~50bps in the three months preceding the fund’s failure, then widened another 20bps, but ultimately tightened 45bps within five months. Similarly, the 2-Year Treasury yield fell about 75bps leading up to the event, fell a further 100bps in line with fed funds, and rebounded ~140bps over the next four to five months. Stocks fell 12%, bounced around in a relatively narrow range from August to November, then moved materially higher.
9/11 (2001)
Twenty-one years ago, a disastrous terrorist attack was unleashed on the northeastern US, leaving ~3,000 dead and billions in property damage. The stock market was closed for a week. On the first day of trading, it fell 5%; it further declined 7% over the following week, then closed the year 6% higher than the day before the attack. Treasury rates, a traditional safe haven, fell 50+bps in the short end over the first week and 120+bps in the first two months, eventually dragging longer rates down as well. The Fed stepped in and cut fed funds four times, by a total of 175bps, by mid-December.
Corporate spreads were initially 30bps wider, then gradually tightened to pre-attack levels over the following six months. All in, markets recovered reasonably quickly given the emotional and financial damage caused by this extreme event.
WorldCom (2002)
In July 2002, WorldCom filed for the largest bankruptcy ever (later surpassed only by Lehman Brothers and Washington Mutual). This was a period of corporate scandal, led by Enron in December 2001, WorldCom in July 2002, and Tyco in September 2002, among others. As this was a somewhat isolated corporate event, the Fed stood pat, keeping the fed funds rate the same until November 2002. Treasury rates, measured by the 2 Year, had been falling for several months, and continued to drop another 60bps thereafter. Stocks had a weak first half in 2002 and dropped about 10% in the days after WorldCom’s filing but recovered and moved higher within weeks.
Corporate spreads moved ~35bps wider in the month leading up to the filing and continued to move ~50bps wider in the ensuing month. Even with all this troublesome news, corporate spreads widened only about 100bps from the June tight to the October wide, recovered to end 2002 only 25bps wider than the day before the WorldCom news, and continued their run in 2003, tightening 90bps.
Global Financial Crisis (2007-2009)
Led by easy lending conditions and an overexuberant housing market, the music stopped when many large banks and financial institutions found themselves saddled with illiquidity and/or bad loans. Bear Stearns, Countrywide, Washington Mutual, AIG, etc. The final shoe dropped about fourteen years ago in September, when Lehman Brothers collapsed. Emotions swirled among the many homeowners who lost their homes and investors who lost much of their wealth. Again, there was a liquidity panic, the economy rolled into recession, and the Fed stepped in, cutting rates three times totaling 175bps over three months. The 2-Year Treasury yield fell ~80bps in the three months immediately prior to Lehman’s demise, then another 150bps through year end 2008.
Credit spreads widened nearly 300bps in three months, but fully recovered that and more, tightening nearly 450bps from the December 2008 wides to year end 2009. Stocks dropped over 45% into early March 2009 and are up more than five times since.
Sovereign Debt Challenges (2011)
Coming out of the GFC, Greece had a debt problem. An imbalance of payments and overreliance on foreign capital inflows precipitated a multi-year bailout from stronger eurozone countries, the International Monetary Fund and the European Central Bank. Meanwhile, due to a growing budget deficit and ongoing debt ceiling debate, the US was under rating agency scrutiny, culminating in Standard & Poor’s (S&P) downgrading the US sovereign debt rating from AAA to AA+ on August 5, 2011. The 2-Year Treasury yield fell about 65bps during Q2 and Q3 2011 (while the Fed stood pat), and from August through September, spreads rose ~100bps and stocks fell nearly 18%. A year later, rates were about unchanged, while spreads were 100bps tighter and stocks were up over 30%.
Oil Price Sell-Off (2015-2016)
When oil prices fell by over $80 from June 2014 to February 2016, investment grade corporate bond spreads widened over 100bps and substantially more within the energy sector. The market wasn’t helped by the December 2015 Fed rate hike – the first since the GFC. Stocks fell 10+% into the early part of 2016. With the Fed sitting tight throughout most of 2016, short rates moved sideways while 10-Year Treasuries rallied by 100bps from June 2015 to June 2016 (based on lower inflation expectations). Stocks bottomed and spreads hit their wides in the first quarter of 2016, then continued firm into 2018, with stocks more than doubling and spreads 130bps tighter over that period.
Fed Hikes, Powell/Trump, Brexit, Trade (2018)
During the fourth quarter of 2018, the Fed hiked rates for the ninth time since late 2015 in an attempt to return rates to a more “normal” level and reduce pressure on a tight labor market. Spreads moved about 50bps wider, and the stock market fell 10% during December, bringing the loss to 15% for the quarter. Beyond rate increases, fears of economic weakness were caused by a budding trade war with China, tariffs, and some jawboning from the President with respect to the Fed. Regardless, spreads eventually narrowed by 50bps and the stock market hit new highs within four months.
COVID-19 Pandemic (2020)
In 2020, a highly contagious, deadly virus spread rapidly and locked-down the global economy. Over 6.5 million people have died worldwide, including over one million Americans. Again, we felt a range of emotions and impacts. Will we ever travel again? When can our kids go back to school? What does hybrid work look like going forward? US Gross Domestic Product (GDP) fell at an annual rate of 31% in 2Q 2020, then rebounded smartly by 34% in 3Q. The Fed cut the target fed funds rate 175bps to a zero lower bound during March 2020, where it remained until March 2022. 2-Year Treasuries tracked fed funds, dropping 100bps from late February through March 2020, then moved sideways until the late 2021 uptick in anticipation of Fed rate increases. The stock market dropped over 30% in a month, and then more than doubled from the low over the following two years.
Corporate spreads widened from the late February’s multi-year lows of less than 100bps to 373bps in late March, only to recover to 200bps within a month, and then close the year inside 100bps. Quite the volatility and quick round trip!
Inflation (2022)
The Fed began raising rates in March 2022 to head off what was formerly believed to be “transitory” inflation. Although energy prices had been moving higher with the post-pandemic recovery, Russia’s invasion of Ukraine caused further ripples, especially with gas pricing in Europe (see our recent blog Winter is Coming). Higher rates quelled the 2020-2021 housing market exuberance, and supply chain dislocations added to the cost of most everything, notably food, cars, and materials for household improvement.
When rates rise, we typically see late-cycle tightening in corporate spreads, as the economy is still cranking and the Fed is moving to stave off excesses. This year, however, spreads widened 60+bps during the first half, and are now about 45bps wider in anticipation of a recession, cost pressures, and margin erosion. Equities are down 15-20%, though energy is a standout performer, up nearly 50%. It remains to be seen how much the Fed will move, where the economy shakes out, and the extent of the current/upcoming buying opportunities.
Summary
Market timing is difficult, and upsets usually lead to opportunities, especially because we believe that spreads tend to mean-revert over time. At IR+M, we “take what the market gives us,” using a measured approach to seek out attractive security selection opportunities rather than making duration bets or large asset allocation swings. Speaking of swings, we’ll be watching swinging tennis racquets as the remainder of the US Open tournament plays out this week. Which players will seize the opportunities in front of them? Can Tiafoe make it past third-ranked Carlos Alcaraz to reach the finals? We’ll be cheering for him!