Russia’s invasion of Ukraine, and Europe’s swift response with sanctions has created a seismic shift in global natural gas markets. US dollar bond investors typically follow European natural gas prices with a casual eye. That all changed when Germany cancelled the Nord Stream 2 pipeline project and Russia retaliated by slowing natural gas supply to a trickle. Europe, particularly Germany, relies on abundant Russian natural gas to fill storage tanks during the summer months to fuel homes and businesses throughout the winter. Europe is now in a tenuous position of restructuring its energy sources and uses in a matter of months, in what normally would require years if not decades of planning. The EU receives approximately 40% of its natural gas from Russia and the European Commission has outlined a plan to wean itself off Russian gas by 2030. This is a monumental task.
What impact does Russia’s invasion of Ukraine have on European and US natural gas prices?
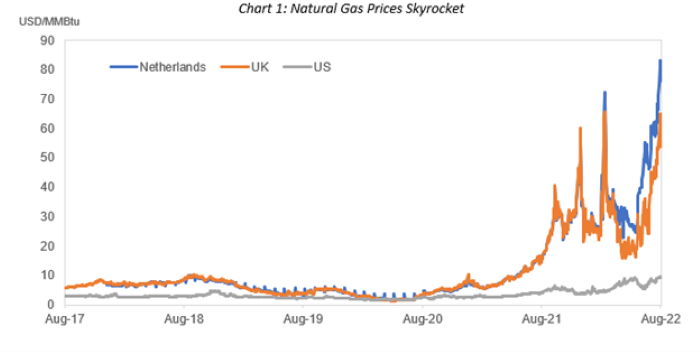
Natural gas prices in Europe, quoted in the UK (National Balancing Point, or NBP) and the Netherlands (Title Transfer Facility, or TTF), are greater than $60 per MMBtu1 and trade at an astonishingly high premium to the US benchmark, Henry Hub (HH), which trades over $9/MMBtu. HH has risen approximately 150% year-to-date, but that pales in comparison to what has happened in Europe. The US is fortunate to have vast resources of domestic natural gas.
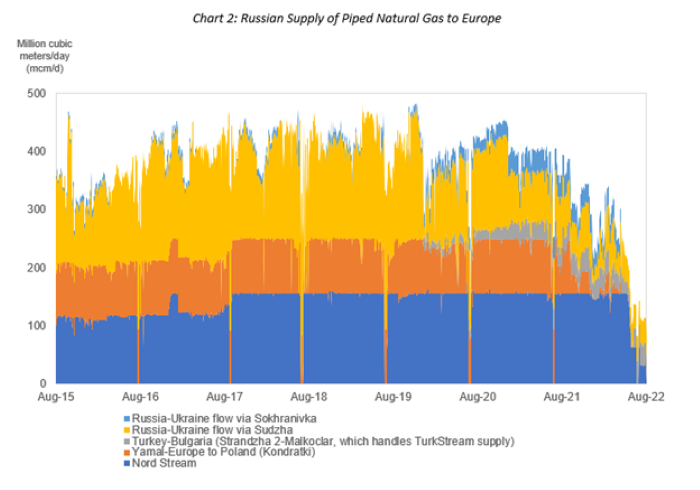
Emergence from COVID-driven lockdowns spurred increased demand for goods and services that utilize natural gas in their supply chains. Both European and US natural gas inventory levels were near or below their five-year average levels heading into the summer, with expectations that storage would improve during the summer injection season. That belief was upended when Russia significantly curtailed pipeline shipments of natural gas to Europe.
 The short supply of natural gas in Europe led to a call on imported liquefied natural gas2 (LNG) from other regions around the world. The US is Europe’s largest supplier of LNG, and facilities spanning the Gulf Coast have been running at or above capacity, aside from routine maintenance and the one-off operational event. US LNG producers would love to ship more supply to Europe but moving new projects from Final Investment Decision (FID) to production takes several years to execute. The majority of newly sanctioned projects are not expected to start up until 2024/2025.
Who is impacted?
As natural gas prices skyrocket, we have already witnessed several European commodity producers shut down or curtail facilities as they fail to turn a profit due to higher natural gas and electricity costs. Energy-intensive industries in Europe like chemicals and metals & mining will have a difficult time competing against global producers that have energy and feedstock cost advantages.
To-date, the impact from rising natural gas costs in the US has been relatively muted, largely because many companies have been able to increase the selling prices of their goods to help offset higher input costs. However, there comes a point where natural gas prices rise to a level that is unsustainable, and we may be approaching that level in Europe.
Response: All-of-the above
With the lack of incremental LNG available to Europe to replace Russian gas in the near-term, there has been a resurgence of coal and oil-fired power plants as generators switch to lower-cost hydrocarbons, despite the environmental impacts. In fact, crude oil exports from the US reached a record five million barrels per day in August with Europe as a leading destination. France has proposed the nationalization of its largest utility after it sought to protect customers from electricity price spikes, but weakened the utility’s financial position. Germany has stalled its plan to retire remaining nuclear plants. Google searches for the word “brennholz” (English: firewood) have exploded as German households prepare for energy shortages.
With respect to renewables, under the European Commission’s REPowerEU Plan to reduce Europe’s dependence on Russian fossil fuels, the Commissions targets 40-45% of power generation from renewable sources by 2030. This will have little impact in the short run. In the US, the recently enacted Inflation Reduction Act provides billions of dollars in tax credits, funding, and incentives for clean energy investments in wind, solar, hydrogen, electric vehicle infrastructure, and carbon capture. Again, these are long-term initiatives that do not cure the acute supply-side energy crisis.
Something must give
The European Commission is proposing member countries reduce their natural gas consumption by 15% in the coming months to ration and build inventory levels ahead of winter, amid rising concerns that Russia could shut off gas supplies completely and threaten the ability of residents to heat their homes and companies to operate their facilities.
If Europe’s natural gas inventories are not adequately replenished before winter, and Russia curtails supplies to the region during a colder-than-normal winter, industrial production in Europe could be severely impacted as residential home heating is prioritized.
Where is the opportunity?
Based on the risks highlighted above, we maintain a cautious posture towards issuers with material industrial production in Europe. Our pragmatic, bottom-up security selection process helps us identify relative winners and losers, and we are finding opportunities to invest across the quality spectrum and capital structures. We see value in energy issuers benefitting from higher commodity prices and volumes and in packaging credits that benefit from contractual cost pass-throughs that help insulate cashflows from rising costs, to name a few. As we hang on to the final days of summer, we know that “winter is coming,” and we are insulating our portfolios from the chilling effects of a natural gas market that is on fire.