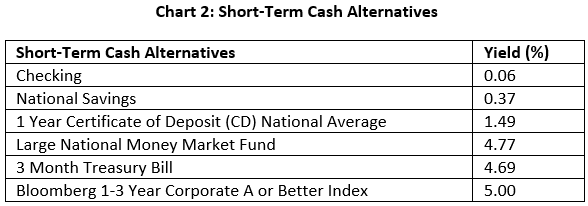
Over the last year, the landscape for short-term investments has changed dramatically, with the Federal Reserve (Fed) enacting its first rate hike in four years in March 2022. With each Fed rate increase, the yields of short duration fixed income have risen in sympathy, some more notably than others. While the average yield for bank deposits has increased from 0.06% to 0.37%, money market fund yields have ballooned from 0.01% to 4.77%, prompting a surge of outflows from bank deposits to higher yielding alternatives. Given the elevated absolute level of rates, the opportunity cost of not evaluating short term and cash investment options has grown. However, that decision is more nuanced than just evaluating stated yields. Depending on the investment product and investor’s state of residence, the choice isn’t necessarily an obvious one, especially when taxes are considered.
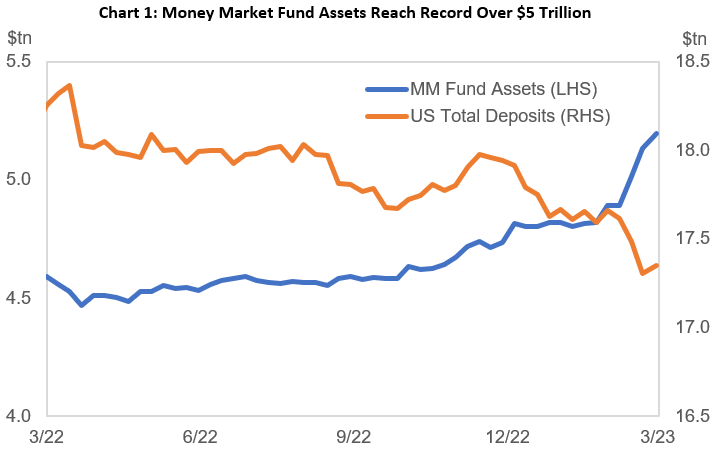
Money Market Fund Assets Surge, While Bank Deposit Assets Decline
Whether prompted by banking sector concerns or an enhanced awareness of rates, many investors have recently shifted their money from bank accounts to money market funds. In the last 12 months, money market fund assets have grown $600 billion, from $4.6 trillion to $5.2 trillion, with an estimated $500 billion migrating over in the last three months alone. Meanwhile, bank deposits have dropped over $900 billion since March 2022 to $17.3 trillion, their lowest level in 19 months.
The income differential between bank deposit funds and money market funds can be substantial. Money market funds have outyielded bank checking and savings accounts rates by a staggering 469bps and 438bps, respectively.
But these numbers can be deceiving, given they fail to account for the invisible role that taxes can play. As our recent mailer highlights, it’s not what you make, but what you keep. On average, many large money market funds are comprised of 55% in repurchase agreements (repos) and 45% in Treasuries. A repo is a short-term loan typically secured by government securities. A borrower sells these government securities to an investor, usually on an overnight basis, and agrees to repurchase them at a higher price on a future date. Repos are taxable at both the federal and state levels, while Treasuries are only taxable at the federal level. Money market investors who live in high tax states like California, New York, or Massachusetts should be aware of the potential for significant additional state taxes associated with repo agreements in their money market funds. Investors who live in a no tax state like Florida or Texas may not have to consider these adverse tax consequences.
Doing the Math
The numbers don’t lie. For an investor in the top income bracket in a high tax state, the after-tax yield for a large money market fund is more than 200bps lower than the advertised yield of 4.77%. Although the after-tax yield is still significantly higher than the yield on bank deposits, it is certainly not as appealing. We believe there are similar duration alternatives that offer comparable yields with fewer adverse tax implications.
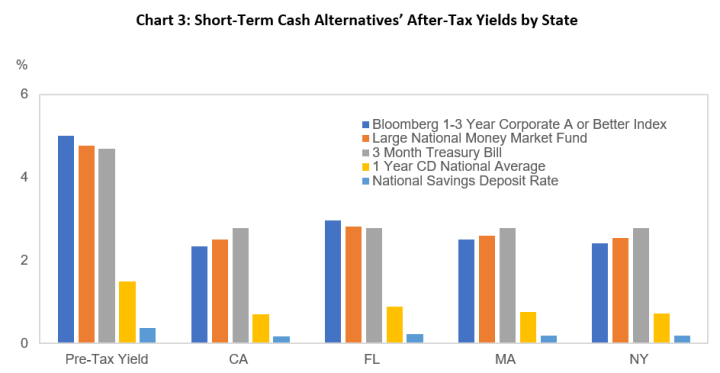
What Are the Alternatives?
While the stated yields of money market funds may appear attractive, we believe that short-term Treasuries – and their state tax exemption – provide investors, particularly those in high tax states, with an attractive alternative with fewer tax implications. For investors in the top income tax bracket, the after-tax yield is 2.78%, which out-yields the after-tax yields of sizable money market funds. Similarly, high-quality municipal bonds, or even short corporate bonds, may be more attractive.
As we approach Tax Day on April 18th, we’re reminded of one of our favorite IR+M sayings – it’s not what you make, it’s what you keep. With that in mind, we believe it is important for tax-sensitive investors to evaluate all available options. The potential tax implications have grown as rates have risen, making the opportunity cost of doing nothing even greater.