While it’s not new news that the Treasury yield curve is inverted – the 2-year has been outyielding the 10-year for months – its front-end volatility continues to garner headlines. Historically a harbinger of an economic recession, the 2s10s spread hit a record -103bps on March 7, 2023, before retreating to -90bps at week’s end; it has since retreated to -51bps. The yield curve’s mercurial nature has been great trading desk fodder, but what else is it telling us? Depending on your state of domicile… maybe a lot.
Here Today… Gone Tomorrow
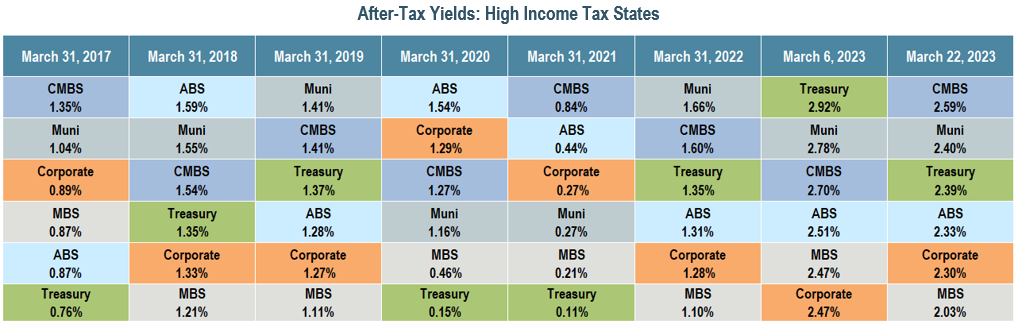
Dating back to March 2017, we compared the historical after-tax yields of six high-quality, fixed income sectors: asset-backed securities (ABS), commercial mortgage-backed securities (CMBS), corporate bonds, mortgage-backed securities (MBS), municipal bonds, and Treasuries. Our analysis featured two distinct scenarios – one for investors who reside in high income tax states like California or New York, and one for those who reside in low – or no – income tax states. The results challenge a one-size-fits-all approach to investing. For those investors who live in high tax states, the data shows that Treasuries’ state and local tax exemption is a compelling benefit today. That hasn’t always been the case. In three out of the past seven years, Treasuries’ after-tax yields ranked last, confirming that when high-quality bond spreads widen, the relative attractiveness of these sectors can change.
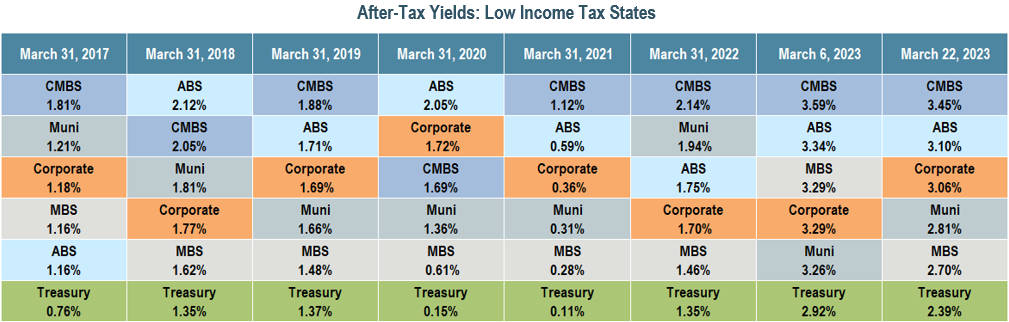
For those investors who live in states with low – or no – income taxes, the data reveals the diminished efficacy of Treasuries’ state tax exemption. As seen in the chart below, since March 2017, Treasuries consistently ranked last in terms of after-tax yields.
The Value of Dynamic Sector Rotation
We believe that these ever-evolving market dynamics underscore the importance of being nimble and opportunistic as investors – regardless of their state of domicile. For example, over the last 25 years, we have found that ABS, MBS, and CMBS, all of which are rated AAA, have been excellent alternatives to corporate bonds. We have used these securitized bonds in our high-quality short strategies to enhance yield and improve diversification. The data in both tax rate scenarios corroborates our decision, with at least one of these securitized structures out-yielding corporates on an after-tax basis in all years. It also highlights the benefit of being flexible, particularly during rapidly developing market conditions.
With so much market uncertainty, we believe that dynamic sector rotation adds value in both tax-sensitive and traditional bond strategies. These large-scale movements create opportunities for discerning investors, and at IR+M, our team is poised to take advantage of what the market gives us.
Sources: Bloomberg and ICE BofA as of 3/22/23. Table 1 (After-Tax Yields: High Income Tax States) after-tax calculations use an assumed tax rate of 40.8% and a state tax rate of 10.9% (New York) and 3.876% (New York City). Table 2 (After-Tax Yields: Low Income Tax States) after-tax calculations uses an assumed tax rate of 40.8%. Sectors shown in the above table are based on Bloomberg and ICE BofA Indices. CMBS = Bloomberg Non-Agency CMBS Agg Eligible Index. Muni = Bloomberg Municipal 1-3 Year Index. Corporate = Bloomberg US Corporate 1-3 Year Index. Treasury = Bloomberg US Treasury 1-3 Year Index. MBS = Bloomberg US MBS Conventional 1-3yr Index. ABS = ICE BofA AAA US Fixed Rate Miscellaneous ABS Index. Source ICE Data Indices, LLC (“ICE Data”), is used with permission. ICE Data, its affiliates and their respective third-party suppliers disclaim any and all warranties and representations, express and/or implied, including any warranties of merchantability or fitness for a particular purpose or use, including the indices, index data and any data included in, related to, or derived therefrom. Neither ICE Data, its affiliates nor their respective third-party providers shall be subject to any damages or liability with respect to the adequacy, accuracy, timeliness or completeness of the indices or the index data or any component thereof, and the indices and index data and all components thereof are provided on an “as is” basis and your use is at your own risk. ICE Data, its affiliates and their respective third-party suppliers do not sponsor, endorse, or recommend IR+M, or any of its products or services. The views contained in this report are those of Income Research & Management (“IR+M”) and are based on information obtained by IR+M from sources that are believed to be reliable but IR+M makes no guarantee as to the accuracy or completeness of the underlying third-party data used to form IR+M’s views and opinions. This report is for informational purposes only and is not intended to provide specific advice, recommendations, or projected returns for any particular IR+M product. Investing in securities involves risk of loss that clients should be prepared to bear. More specifically, investing in the bond market is subject to certain risks including but not limited to market, interest rate, credit, call or prepayment, extension, issuer, and inflation risk. It should not be assumed that the yields or any other data presented exist today or will in the future. It should not be assumed that recommendations made will be profitable in the future. Actual results may vary. No part of this material may be reproduced in any form, or referred to in any other publication, without express written permission from Income Research & Management. “Bloomberg®” and Bloomberg Indices are service marks of Bloomberg Finance L.P. and its affiliates, including Bloomberg Index Services Limited (“BISL”), the administrator of the index (collectively, “Bloomberg”) and have been licensed for use for certain purposes by IR+M. Bloomberg is not affiliated with IR+M, and Bloomberg does not approve, endorse, review, or recommend the products described herein. Bloomberg does not guarantee the timeliness, accurateness, or completeness of any data or information relating to any IR+M product.