- The market kicked off the new year with a slate of mixed economic data releases, while investors contemplated the long-term impact of the US’ large-scale strike against Venezuela, capturing then President Nicolás Maduro
- December’s ADP employment change report pointed to a gradually cooling labor market with 41,000 jobs created in the private sector - 9,000 below expectations
- The ISM Services Index beat expectations, rising to 54.4 in December –the highest level since October 2024 – fueled by a surge in new orders and the first employment gain since May 2025
- Conversely, December factory activity shrank by the most since 2024, as the ISM Manufacturing index fell from 48.2 to 47.9
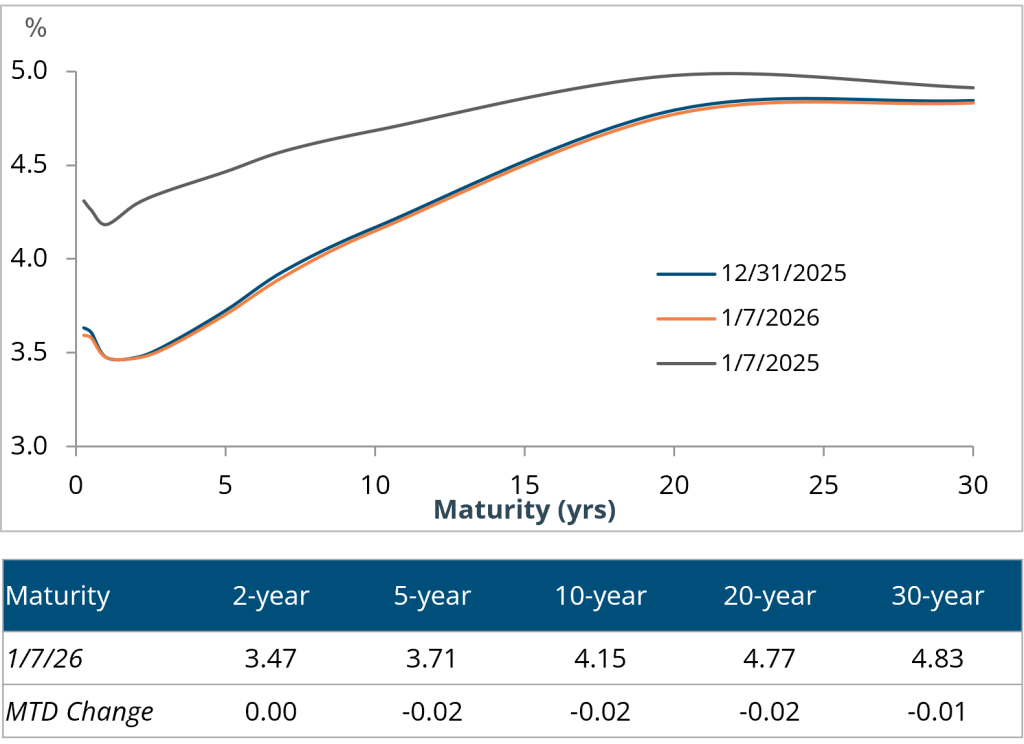
- The Treasury curve flattened modestly week-over-week following the soft ISM manufacturing data; the spread between the 2- and 10-year Treasury rates tightened 1bp to 68bps
- Investment-grade (IG) borrowers flooded the primary market as supply totaled over $88 billion – the fourth busiest week ever; Yankee banks led the rush and accounted for over 40% of issuers
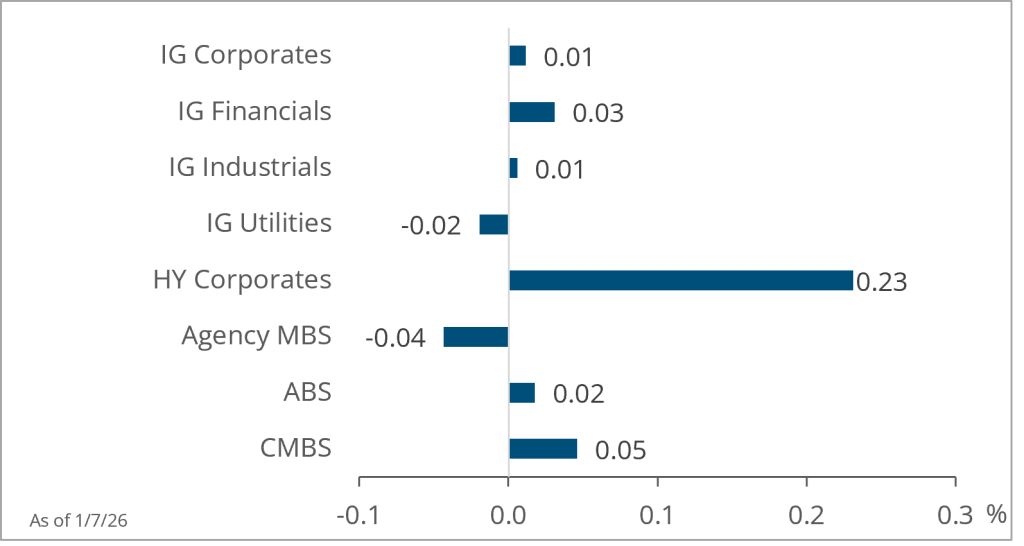
- Investment-grade corporate spreads widened 1bp to 78bps, while yields remained unchanged at 4.81%
- High-yield (HY) issuers were similarly active and capitalized on robust demand, pricing nearly $7 billion of new debt
- High-yield corporate spreads tightened 5bps to 261bps, near an eleven-month low, and yields fell 6bps to 6.47%
- Agency mortgage-backed securities (MBS) underperformed other securitized sectors as spreads widened 2bps to 24bps
- President Trump announced an effort to ban institutional investors from buying single-family homes to address housing affordability; however, investors claim more details are needed to project the potential impact
- Municipals outperformed Treasuries as muni/Treasury ratios fell across the curve; demand remained strong as municipal bond funds reported $407 million of net inflows for the final week of the year
Treasury Yield Curve
Month-to-Date Excess Returns