History has taught us markets can be generous or punishing. Hindsight is 20/20, but LDI discipline can protect funded status gains in the face of market volatility.
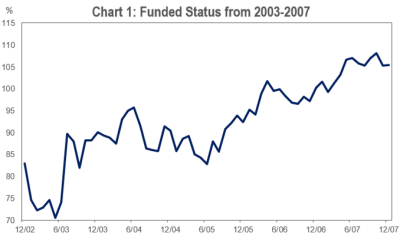
Pre- GFC: If you were a corporate pension plan sponsor from 2003 to 2007, you were feeling pretty good (as one should with the dot-com bubble in the rear view…). You had the benefit of domestic equity markets rising by over 14% annually while discount rates were relatively flat. Most plans had a healthy allocation to risk assets over that time, so plan asset growth easily outpaced relatively flat liabilities. The average funded status of the top 100 pension plans rose from roughly 70% to over 100% in just four years, digging plans out of their lowest funded ratio since Milliman began keeping records in 1998.
Getting to fully-funded status can be the holy grail in the liability driven investing (LDI) world; assets set aside should now be sufficient to pay participants for the entirety of retirement. Pensioners rejoice. Many plans will shift assets from growth assets (equities, alternatives, private assets) to hedging assets (fixed income) as funded status improves to lock in that higher funded status and “take some chips off the table”, if you will. The liabilities of pension plans move in a similar fashion as bonds – and are commonly discounted using the yields of high-quality corporate fixed income – so investing in the sector tends to reduce the tracking error between assets and liabilities (this is the essence of LDI investing). The concept is similar to Target Date Funds within 401k defined contribution plans; as you get closer to the “target date”, the advisor of the fund will shift investments into bonds and from equities to reduce the volatility or risk of the fund.
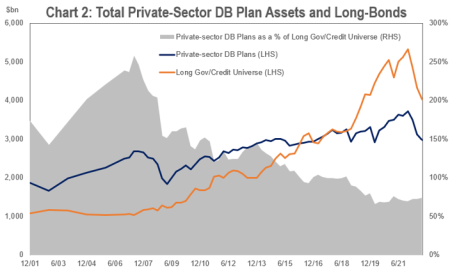
Investing some allocation to equities, even at 100% funded, can still make sense. Service costs, or accruals, can erode a plan’s funded status over time if a sponsor does not make contributions or outperform that cost. This may justify why the average corporate defined benefit (DB) pension plan did not move all assets to fixed income in 2007 at full funding. In fact, as shown in Chart 2, there weren’t enough long-duration government and credit bonds available for all pension plans to hypothetically invest in solely fixed income anyways. At an average growth asset allocation of around 70%, however, plans were highly exposed to equity markets.
To improve the interest rate hedge ratio, the average plan at the time could have extended the duration of the fixed-income portion beyond that of their liabilities – “making their fixed-income assets work harder for them”. Interest rate moves would then have a similar impact to assets and liabilities while retaining some growth potential to meet service costs or close funding gaps. However, plans were faced with another issue. It would have been difficult to fully hedge interest rate sensitivity (if they even wanted to) given the low allocation to fixed income. Assuming 30% in fixed income and a liability duration of roughly 15 years, plans would have had to target a fixed income duration of 50 years, a duration unachievable without the use of derivatives and leverage. It is therefore reasonable to assume that most plans were underhedged from an interest rate perspective in 2007 as a result.
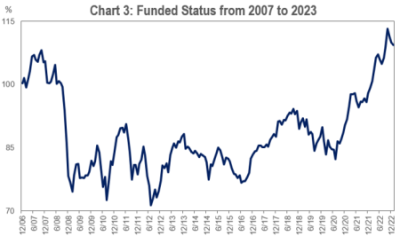
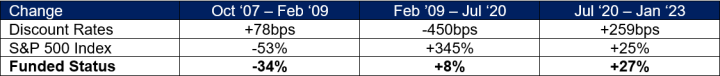
The GFC: What happened next? When the US was in the midst of the Great Financial Crisis, equity markets collapsed while credit spreads widened and pushed corporate bond yields higher. Higher yields can be beneficial to funded statuses because liabilities are discounted using higher rates and thus decrease. However, plans were more exposed to growth assets, which had lost over 50% from October 2007 to February 2009. The confluence of events led the average funded status to plummet back to similar levels as 2003 of below 80%. It would take plan sponsors almost 15 years for the average funded status to recover and exceed 100% again.
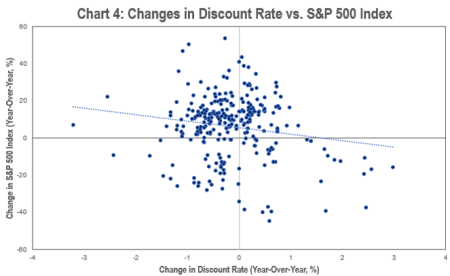
Post-GFC: Luckily, the market eventually moved back into pension plans favor. The period between July 2020 and January 2023 was just what the doctor ordered for LDI investors for years; it was an exacta of rising discount rates and equity prices that led to lower liability and higher asset values. Discount rates from July 2020 to January 2023 jumped from 2.26% to 4.85%, a whopping increase of 259bps, and equity prices rose by roughly 25%. This relationship – discount rates and equity prices both rising – is not exactly common. Chart 4 plots the year-over-year changes in discount rates and the price of the S&P 500 Index. There is not a strong relationship between the two, but it does skew slightly negative meaning they tend to move in opposite directions most of the time.
So, now we find the average DB plan with a funded status of roughly 103% as of the latest month-end. What should one do? We think it is important for plan sponsors to remember the market can be a fickle beast, why they embarked on an LDI journey in the first place, and how far they’ve come. LDI is a long-term strategy, with the focus on removing risk and ensuring hedging portfolios help protect the funded status of sponsors’ defined benefit plans from market volatility. Plans need growth assets and hedging assets to work together. That can certainly happen (see 2020-2023), but the two can also leave you waiting (2009-2020) or hurting (2007-2009). At IR+M, we think sticking to glidepaths and moving some growth exposure over to hedging assets as a plan’s funded status improves can reduce asset-liability tracking error, especially after a period of large funded-status gains. Theresa Roy’s LDI blog post is a memorable mantra based on these historic swings in funded status, Live. Learn. Hedge Well.