This time of year, notably the weeks preceding the end of Daylight Saving Time, Boston mornings are especially dark at 6am. Yet its narrow, curving streets are bustling with commuters — pedestrians, cyclists, cars, buses, and big box trucks. This early morning “dark season” is sneakily dangerous. Bleary eyes, inky darkness, and frantic commuting schedules inevitably result in accidents. Just ask my wife, an emergency room physician.
The Fed has entered its own “dark season”. With economic reopening morphing into inflationary pressures, the FOMC is increasingly scrutinized for its ongoing zero interest rate policy. True, a variety of markets have leveraged this continued period of cheap money to make all-time highs, but now the economic tea leaves have seemingly turned to reveal potential long-term consequences.
Monetary Policy: Behind the Curve?
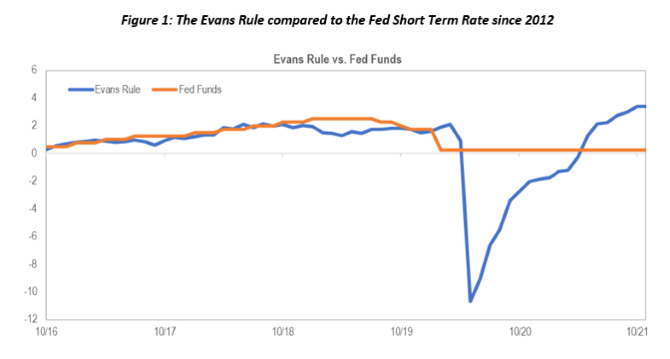
The bond market has historically taken solace in formulaic Fed forecasts. Perhaps the most well-known is the Taylor Rule, a theory derived by Stanford Professor John Taylor. It posits that the Fed raises or lowers its overnight rate in equal response to inflation and economic growth slack (using the unemployment rate as a proxy). The relevance of this formulaic forecasting tool has waned since the Great Financial Crisis, in part because the Phillips Curve, or the relationship between inflation and unemployment, has seemingly disappeared. An alternative methodology, The Evans Rule (TER), named for Chicago Board President Charles Evans, does not assume that lower unemployment equates to higher inflation, but rather states that the FOMC will hold rates near zero until unemployment falls or inflation rises. TER has largely taken the Taylor Rule’s place with Fed watchers. In fact, in 2012, Chair Bernanke mentioned TER’s usefulness in setting policy and the timing and pace of Chair Powell’s last hiking cycle that began in 2015 closely correlated with TER’s implied path (Figure 1).
But TER’s 2021 path suggests that the Fed’s target rate is badly lagging current economic conditions (Figure 1). Today’s 4.8% unemployment rate sits below the 5.0% threshold that began the 2015 rate hikes and core PCE inflation (the Fed’s preferred inflation measure) has raced above 3.6%, making a 30yr high. Both measures would indicate an interest rate hike based on The Evans Rule – though perhaps the unemployment rate and inflation thresholds have changed. How can the Fed be comfortable with this?
Employment: Are We There Yet?
The October jobs report encapsulates a major conundrum for policy makers. The top-line job adds were ~500k below expectations, yet the unemployment rate fell by 0.2%. The reason: unprecedented stagnation in the labor force participation (LFP) rate. Per this measure, the labor force has yet to recoup over 3 million pre-pandemic labor force participants (Figure 2). Have they retired? Perhaps. Do they seek higher wages? Not clear. A 2018 speech given by Powell provides a clue as to how he’s been thinking about it:
“To be counted in the official measure as unemployed, a person must have actively looked for a job in the past four weeks. People who have not looked for work as recently are counted not as unemployed, but as out of the labor force, even though some of them actually want a job and are available to work.”
Clearly, the on-going pandemic continues to wreak havoc on the labor pool – but not counting these missing participants in the unemployment calculation implies that they will never return (see previous blog, Where Have All the Workers Gone? https://www.incomeresearch.com/where-have-all-the-workers-gone/). On the other hand, both Yellen and Powell have referred to a measure that keeps them in the calculation, termed the “fixed participation rate unemployment rate”. This alternative takes the missing labor force participants and adds them back as “unemployed”. So, if approximately 3 million is added to both the numerator and the denominator, the unemployment rate jumps to 6.5%.
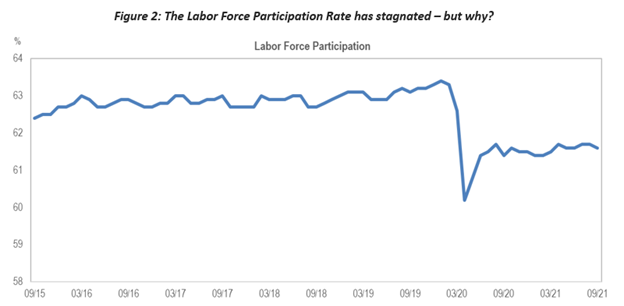
(Source: Bureau of Labor Statistics)
Inflation: Slippery When Wet
The Fed is adamant that the pick-up in inflation is transitory, even if it lasts well into 2022. Furthermore, under their Flexible Average Inflation Targeting (FAIT) approach, unveiled by Powell at the 2020 Jackson Hole Conference, inflation is no longer capped at 2.5%, but instead is targeted to average that amount over the course of years. The timing of this announcement was especially telling given that inflation was trending well below 2% at the time. In contrast, 2021 inflation has printed significantly higher than 2.5% to date. But treating 2020 and 2021 as a single two-year measure, puts annual inflation at 3.7%, which seems high but isn’t the highest we’ve experienced when we examine decades-long annual inflation trends (Figure 3).
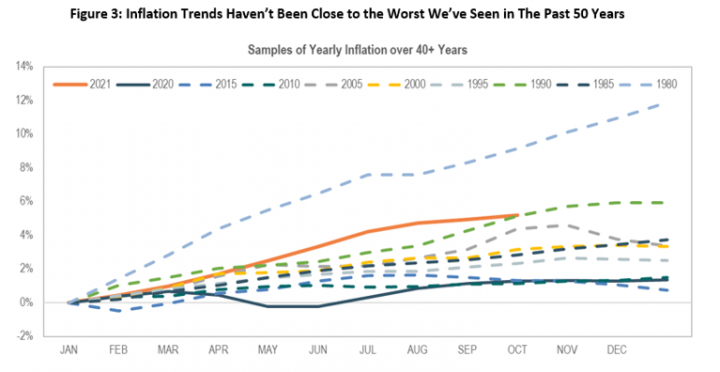
(Source: Bureau of Labor Statistics)
Conclusion
If the Fed is right — the unemployment rate is understating the labor slack and the current inflation surge will catch us up to their desired long-term average — then TER should be close to their current zero rate. This also buys them time, which they need to conduct their QE Taper over the next 6-9 months before they can raise their short-term rate. However, the risk is that they’ve misinterpreted the situation and the labor market is as tight as a drum, the Phillips Curve is alive again, and the Fed has been inadvertently manufacturing runaway inflation.
But what the Powell Fed really needs is for the market not to extrapolate their intentions too far into this unprecedented, uncertain economic future. Their three mandates – maximize economic growth, stabilize inflation, and maintain orderly markets – may no longer be best served by one ultra-dovish approach. The Fed may need to make suboptimal trade-offs, that may result in one or more of their objectives becoming untethered for a time. So, please, buckle up and watch the monetary road.