“Lighter than air, stronger than whiskey, cheaper than dirt.” – John Warne Gates (Barbed Wire Salesman, 1877)
Liquidity. The bond market’s definition is anything but simple. Included but not exhaustive are: Bid-ask price differences, ease of sourcing, price transparency, depth and breadth of market moves, and financing options. While much ink gets spilled over the Federal Reserve’s liquidity injections, structural shifts in primary dealers’ business models can also precipitate long-lasting effects.
The Biggest Ranch of Them All
Liquidity is not a thing but rather a condition. Investors may feel it one day and not the next. It permeates bond trading at all levels – from individual cusips to index level spread movements. Take the $10 trillion Treasury Bond market. Liquidity differences amongst on-the-run issues (e.g., a new 10-year note) and off-the-run issues (e.g., what was originally a 30-year bond with now only 10 years left to maturity) typically have small but persistent yield differentials along the curve. Bloomberg has an index to track the standard deviation of these differences as a relative indicator for overall U.S. Government Bond liquidity over time (Fig. 1).
Bloomberg U.S Govt Securities Liquidity Index
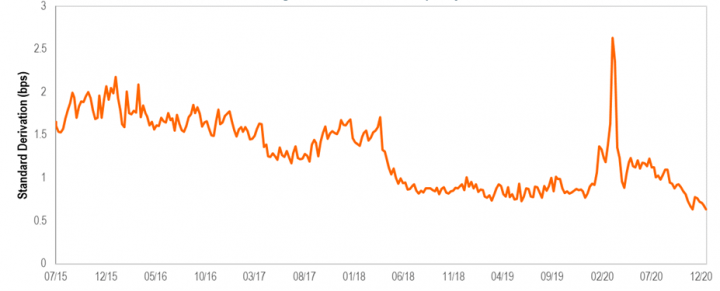
Figure 1 (source: Bloomberg)
The spike in March is no surprise. But notice the liquidity improvement in early 2018 – a period not remembered for significant spread volatility. A little digging on the New York Federal Reserve’s website reveals that Treasury holdings of primary dealers rose significantly around the same time (Figure 2). January 2018 was also the deadline for U.S. Banks to comply with Basel III’s Supplementary Leverage Ratio (SLR) Rule. This required banks to maintain a minimum ratio of Tier 1 capital relative to overall financial leverage. But as the deadline approached, the Treasury recommended that U.S. Treasuries be excluded from the denominator. The result was a liquidity rally in the sector.
Primary Dealer Tsy Holdings (4 Week Moving Average)
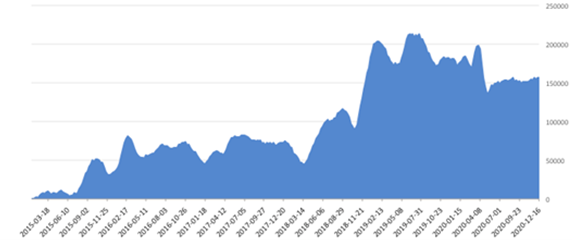
Figure 2 (source: N.Y. Fed)
It’s a similar story for the 2017 Basel III Liquidity Coverage Ratio (LCR) Rule, which requires banks to demonstrate sufficient 30-day liquidity reserves on a risk-weighted basis, which effectively “fenced off” various parts of the market with differing risk characteristics. Consequently, primary dealers upgraded their collateral quality via repurchase agreements (“repo”) financing markets – a form of collateralized lending – in order to borrow more HQLA (High-Quality Liquid Assets), such as Treasuries, in exchange for lending higher risk-weighted assets such as corporate bonds. While this move required the dealers to pay a financing spread, it simultaneously improved liquidity in both markets.
The Credit Herd Moves Together
Bond traders can feel liquidity wax and wane daily. One day, it’s hard to find a bid, and another, it’s hard to find a good bond to buy. Often, it has to do with the street being “heavy” or “light,” expected supply, fund flows, and of course, regulation. Banks have a long history of adapting to regulatory changes, but the process can take years. Basel III was first introduced in 2010 (and Dodd-Frank in 2011), but the broker-dealer community mostly stayed the course until the final versions were inked. The industry then made a collective push to optimize balance sheets and streamline business practices around this new “fencing.” The result was to evolve how they finance their corporate bond inventories.
This evolution didn’t directly trigger market drama. But evidence of liquidity waxing and waning can be found. Figure 3 shows that primary dealer corporate bond inventories are rising again after suffering a decline around the time of LCR and SLR implementation.
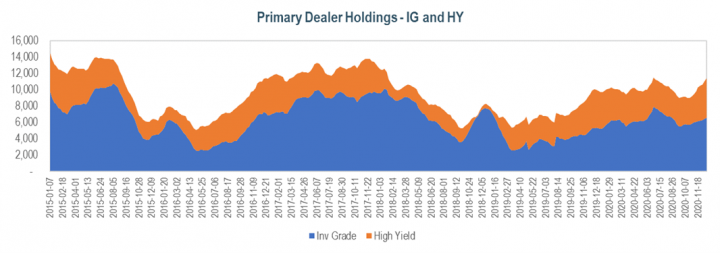
Figure 3 (source: N.Y. Fed)
Other metrics tell the same story. A means to gauge the strength of corporate bond activity is to track the number of industries that tighten together (market breadth; Figure 4) and the number of ratings buckets that tighten together (market depth; Figure 5). Notice how these “herding” metrics bottom-out in 2018 but have gradually risen over the past couple of years. It seems that the dealer community has met these regulatory challenges with new business models that will once again provide broad and deep liquidity for the foreseeable future.
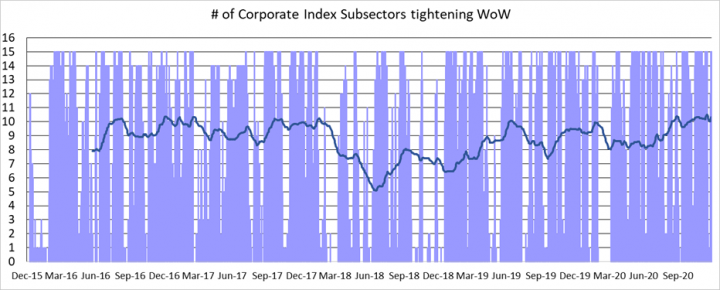
Figure 4 (source: Bloomberg)
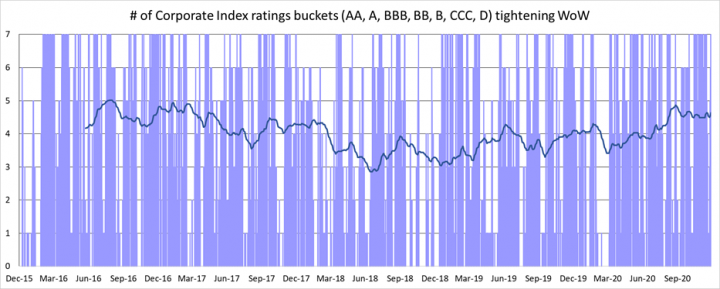
Figure 5 (source: Bloomberg)
The ETF ecosystem development has been a boon to fixed income liquidity, creating new outlets for dealers trying to hedge their books. The ETF create/redeem function, electronic market-making, algorithmic functions, and portfolio trading (lists of bonds executed as one) now provide additional hedging options beyond traditional derivatives and vary in terms of their liquidity.
Conclusion
Barbed wire reshaped the West. The Homestead Act, railroads, and ice-cooled boxcars also played essential roles in accelerating the transformation. Yet, none were viewed as panaceas when first introduced. Regulatory changes in response to past crises can impact liquidity long aftermarket dislocations subside, but primary dealers and the markets have proven to be adaptable. But having cheap and effective financing for inventories remains the bedrock of primary dealers’ market-making abilities. The Federal Reserve’s actions may generate the headlines, but the savvy investor keeps tabs on all of these factors. After all, liquidity remains “the devil’s rope” of the bond market – and it can still cut both ways. At times, investors can be paid well to provide liquidity, while in very liquid markets, off-the-run issues may trade little different than on-the-run. It is paramount to view liquidity in terms of its price to avoid getting fenced in.