
“I think we now understand better how little we understand about inflation.” – Federal Reserve (Fed) Chairman Jay Powell, June 29, 2022
When Fed Chairman Jay Powell pronounced this now infamous statement, the bond market sighed. His epiphany had been realized by Treasury curve pricing as far back as May 6th, or the day the 10-year Treasury yield closed at a then year-to-date high of 3.13%. On that day, the Fed’s target rate was 0.75-1.00% and their median forecast was for it to rise to 1.75-2.00% by the end of the year. We are now barely half-way through 2022 and the Fed’s target rate is now 2.25-2.50% after last Wednesday’s meeting. Their median forecast remains 3.25-3.50% by year-end. Yet, the 10-year Treasury yield is presently trading 40bps lower than that May 6th close. Go figure!
Duration – Is The Worst Behind Us?
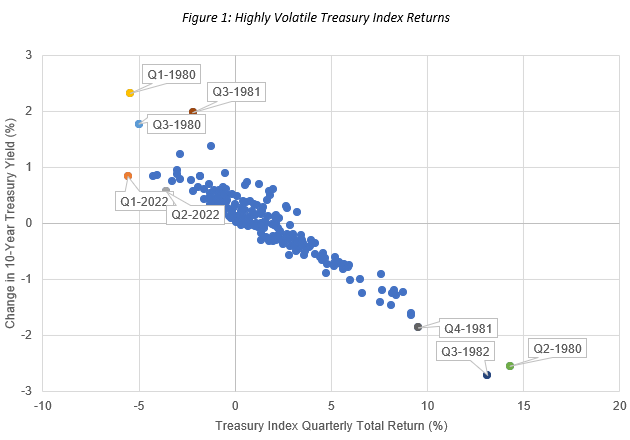
After two very difficult quarters for Treasury returns, is the worst priced in? Perhaps. Interest rate volatility persists, but there’s reason to believe that the bond market’s collective wisdom surpasses that of the Fed governors. Longer Treasury yields demonstrated marked resilience two weeks ago in the face of an ugly Consumer Price Index (CPI) print – one that prompted the short end of the Treasury curve to briefly price in an almost 80% chance of a 100bp hike at July’s Fed meeting and the 10-year Treasury Note to briefly touch 3.50% on June 14th. But the rally since then has been sharp with the 10-year Treasury yield well inside 3% now. This curve resilience is evidence that the most pessimistic paths for Fed tightening are being met with rising concerns about a prolonged disinflationary recession. In fact, Fed Futures now has “only” 3.3 hikes priced into the end of the year, with cuts beginning in early 2023. Lessons from the inflation/economic environment of the early 1980’s may be apropos, as the bond market forecasts a whipsaw in rates building. Two of the worst quarters for Treasury index returns printed in 1980 but were soon followed by several of the best quarterly Treasury index returns in modern history (Figure 1). No one is banking on such a dramatic reversal, but the risk-return trade-off of duration does appear to be more attractive than it has been in years.
Credit – Nothing to See Here… Yet
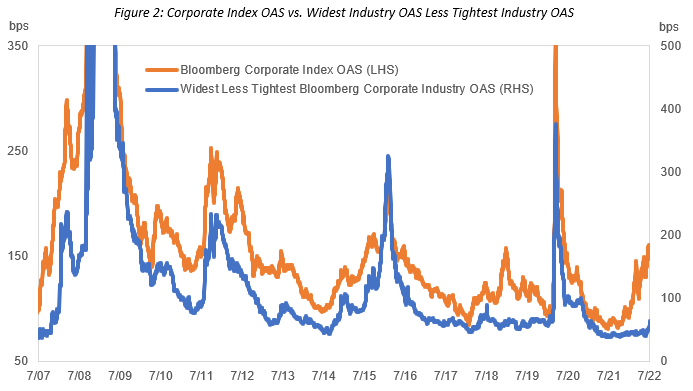
Often, a sizable widening in credit spreads is led by one or more industries headed for restructuring. However, this is not the case today. Figure 2 shows the Corporate Index option-adjusted spread (OAS) (orange line) relative to the basis between the widest and tightest OAS by industry in that Index (blue line). In late 2015/early 2016, the OAS on the Investment Grade Energy and Basics Indices sharply widened. The Energy Index OAS peaked at +464bps on 2/12/16. That same day, the Capital Goods Index OAS closed at +143bp OAS, equating to a wide-tight basis of +321bps. Today’s wide-tight basis is much narrower – the Basic Index OAS closed at +190bps and the Technology Index OAS at +127bps on July 20th. This demonstrates how orderly the corporate bond sell-off has been. Few are rushing for the exits because of default or downgrade fears. Fundamentals remain solid, with leverage lower for several quarters in a row. Yet, the Corporate Index OAS trading with +150bps of additional yield over Treasuries suggests a less than rosy outlook for corporate earnings in the coming quarters. Whether this implied weakness comes from a recession, stagflation, or just a volatile and inflation rattled economy is yet to play out, but at least bond spreads are far more compensatory for any of these scenarios than they were at the beginning of the year.
Convexity – A Whole New Game
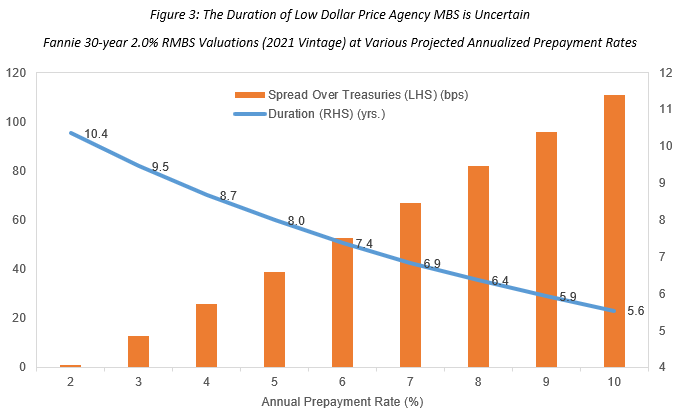
Normally, Existing Home Sales (EHS) is not the top economic indicator moving the Agency Mortgage-Backed Securities (MBS) Market, but times have changed. The Bloomberg MBS Index price is now below $93, thanks to years of strong home sales and refinancing activity that steadily ratcheted the average prime 30-year fixed mortgage rate down to almost 3%. Now the current 30-year mortgage rate has risen to 5.75% so it’s no surprise that refinancing activity has plummeted to 20-year lows. But exactly how slow the lowest coupons in the MBS Index may prepay is a key point of speculation in today’s Agency MBS market. Moving, extracting equity, and defaulting are all non-refinance related drivers of prepayment activity, but these still only typically amount to single-digit annualized rates. Yet, as Figure 3 shows, the duration and spread on the largest cohort in the MBS Index (2021 vintage of Fannie 30-year 2.0% bonds have close to $1 trillion outstanding) differs depending on what that single-digit rate is exactly. For example, at a 6% CPR (conditional prepayment rate), the duration of a 2021 Fannie 2% bond is roughly 7.4 years and yields are approximately 53bps more than a similar duration Treasury. That’s where EHS comes in. If the housing market keeps chugging for the foreseeable future, then it’s reasonable to believe that non-refinance prepayment activity will print at the higher end of this range. But if housing turnover slows (and mobility is often hampered by a recession), then non-refinance prepayment activity may slump to the low single digits. The difference could be as much as 3-4 points in price on these Agency MBS coupons, even if the spread over the Treasury curve remains constant.
Liquidity Concession – Where Are We?
Liquidity is the “take-what-the-market-gives-you” aspect baked into today’s credit spreads. After all, it is simply the benefit earned for being a buy-and-hold investor and comes with no additional fundamental risk. But how can we measure it? Those working in the bond market know all too well that liquidity is not simply the bid/ask spread. It can be “measured” a variety of ways, based on trading volumes, dealer balance sheets, concessions for trade size, “sourceability,” and registration rights. Those that trade the largest sizes in the corporate bond market, including Exchange-Traded Funds (ETFs) and mega-mutual funds, generally do not traffic in smaller deals, especially those that are not in the index and/or are 144As without registration rights. J.P. Morgan estimates that about 85% of investment grade corporate bond trading occurs among only 20% of index-eligible bonds. At IR+M, we monitor liquidity via real-time trade execution, conversations with dealers, Trade Reporting and Compliance Engine (TRACE) prints, and proprietary calculations that include deal size, time since issuance, coupon, etc. With the weaker liquidity in recent weeks, we remain patient in our appetite for providing liquidity in the current market.