For market participants and spectators, 2023 seemingly had a little bit of something for everyone: a nail-biter of an acute banking crisis; near-miss on a US government shutdown; a downgrade of the home team’s credit rating. These events, coupled with ongoing geopolitical conflicts and rate volatility, made 2023 a challenging, but memorable year. With a US presidential election, possible government shutdown, and rate cuts on the horizon, 2024 may be another year awash with momentum shifts and unexpected winners and losers. As investors grapple with persistently high yields and volatility, we believe that there will be opportunities for skilled active managers to shine.
2023 HIGHLIGHT REEL
TODAY’S STANDINGS
PREVIEWING THE 2024 SEASON
THE IR+M 2024 PLAYBOOK
At IR+M, we believe 2024 could be just as eventful as the last year with several potential destabilizers on the horizon. We embrace market environments that have historically led to greater volatility, dispersion, and opportunities. Through active risk management and careful fundamental analysis, we believe fixed income investors should benefit from today’s higher interest rates, which can further buoy long-term returns and provide some protection amidst volatility.
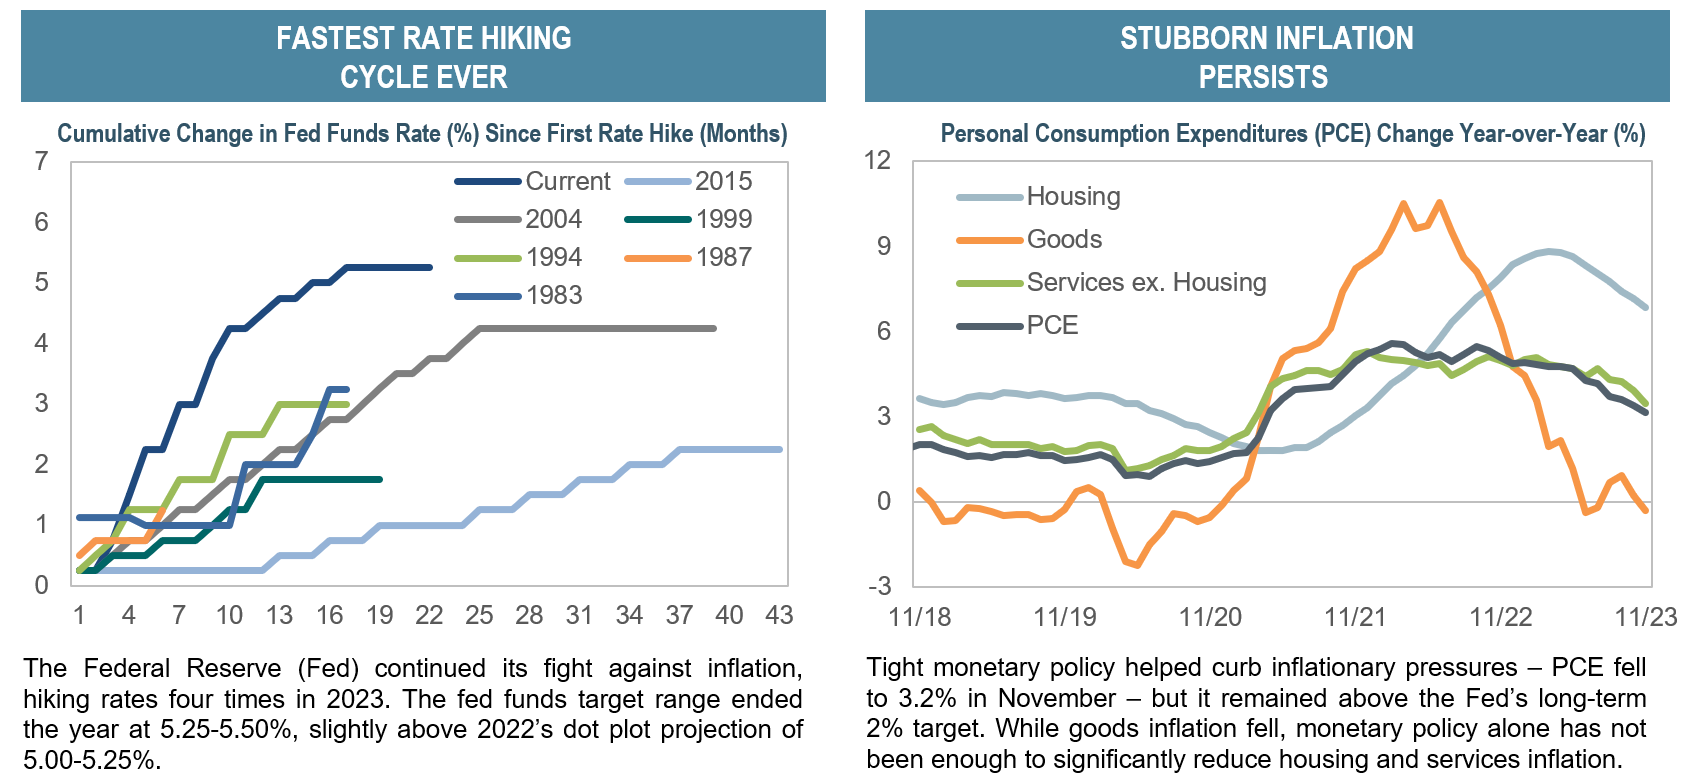
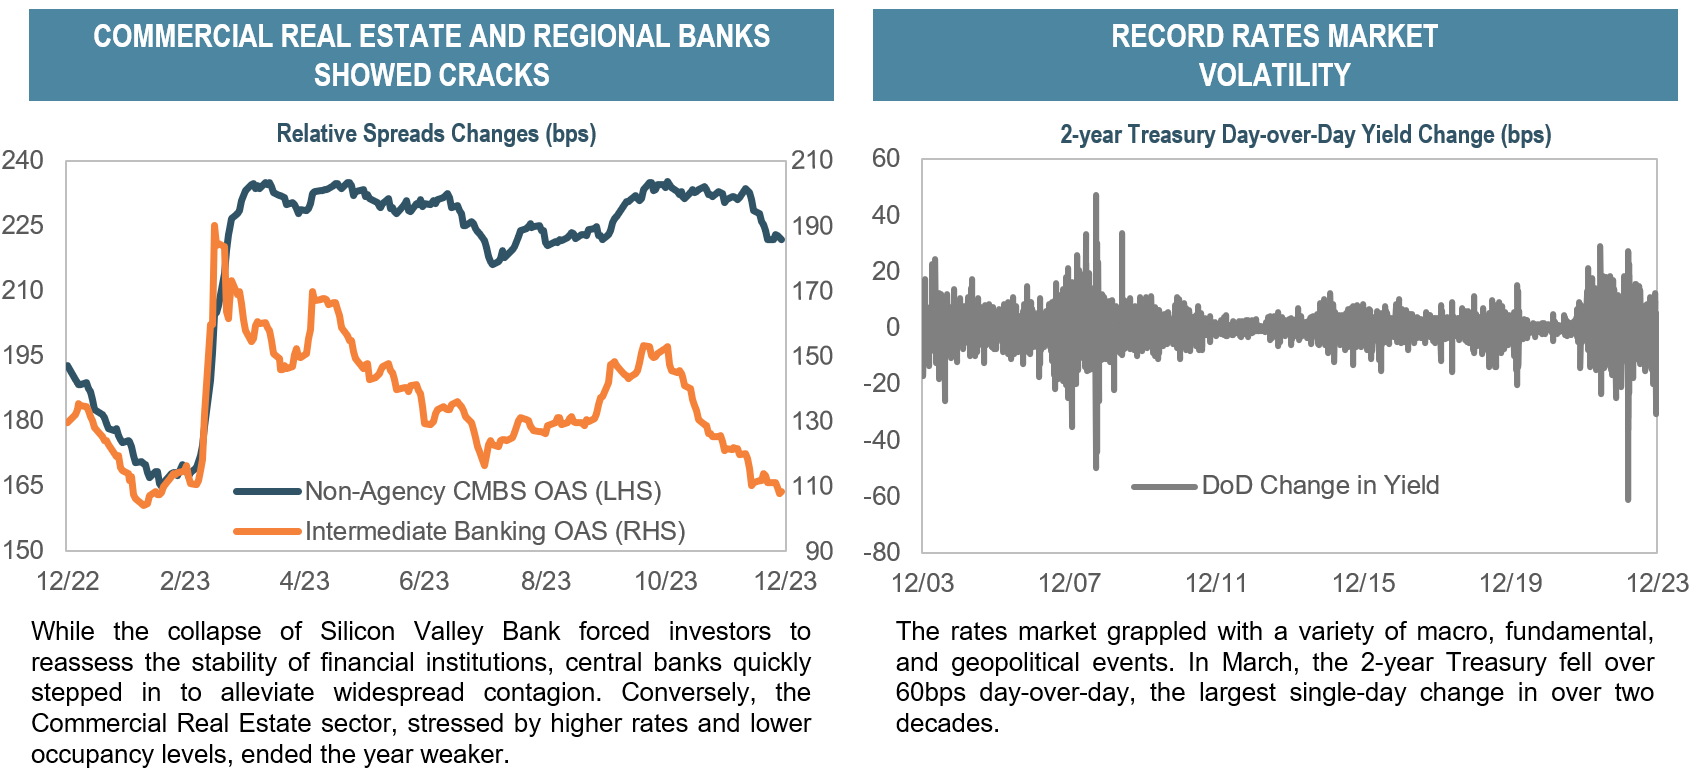
2023 Highlight Reel – Source: Bloomberg as of 12/31/23 unless otherwise stated. Top left chart: Shows the change in Fed Funds Rate (%) during the respective hiking cycles using the Fed Funds Target Range Upper Bound. Top right chart: shows the different components of the Personal Consumption Expenditures (PCE) as of 11/30/23. Bottom left chart: Non-Agency CMBS is based on the Bloomberg Non-Agency Investment Grade CMBS Index. Intermediate Banking is based on the Bloomberg US Intermediate Corp Banking Index.
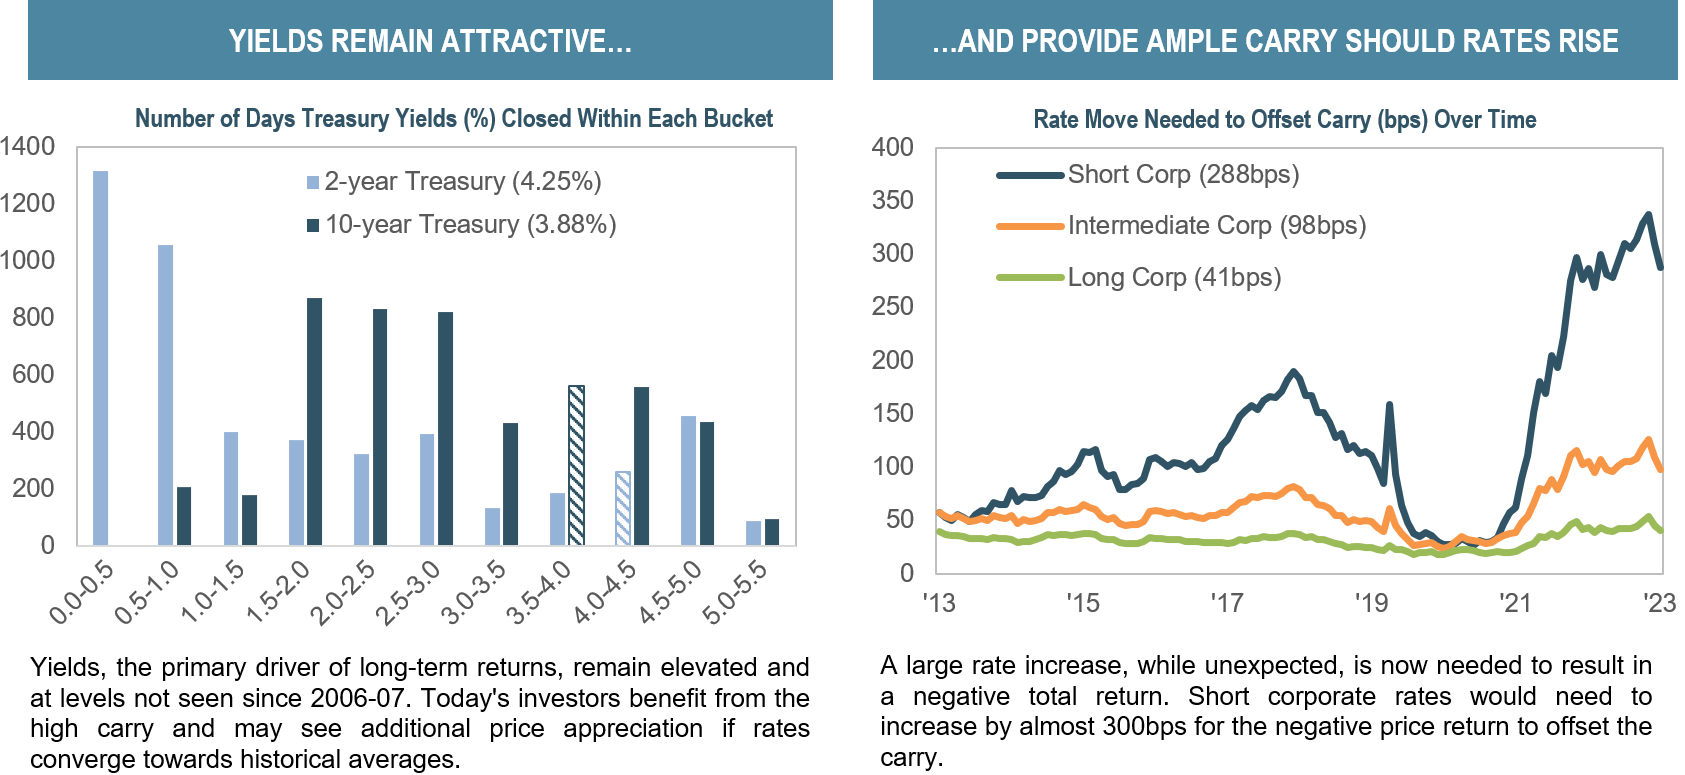
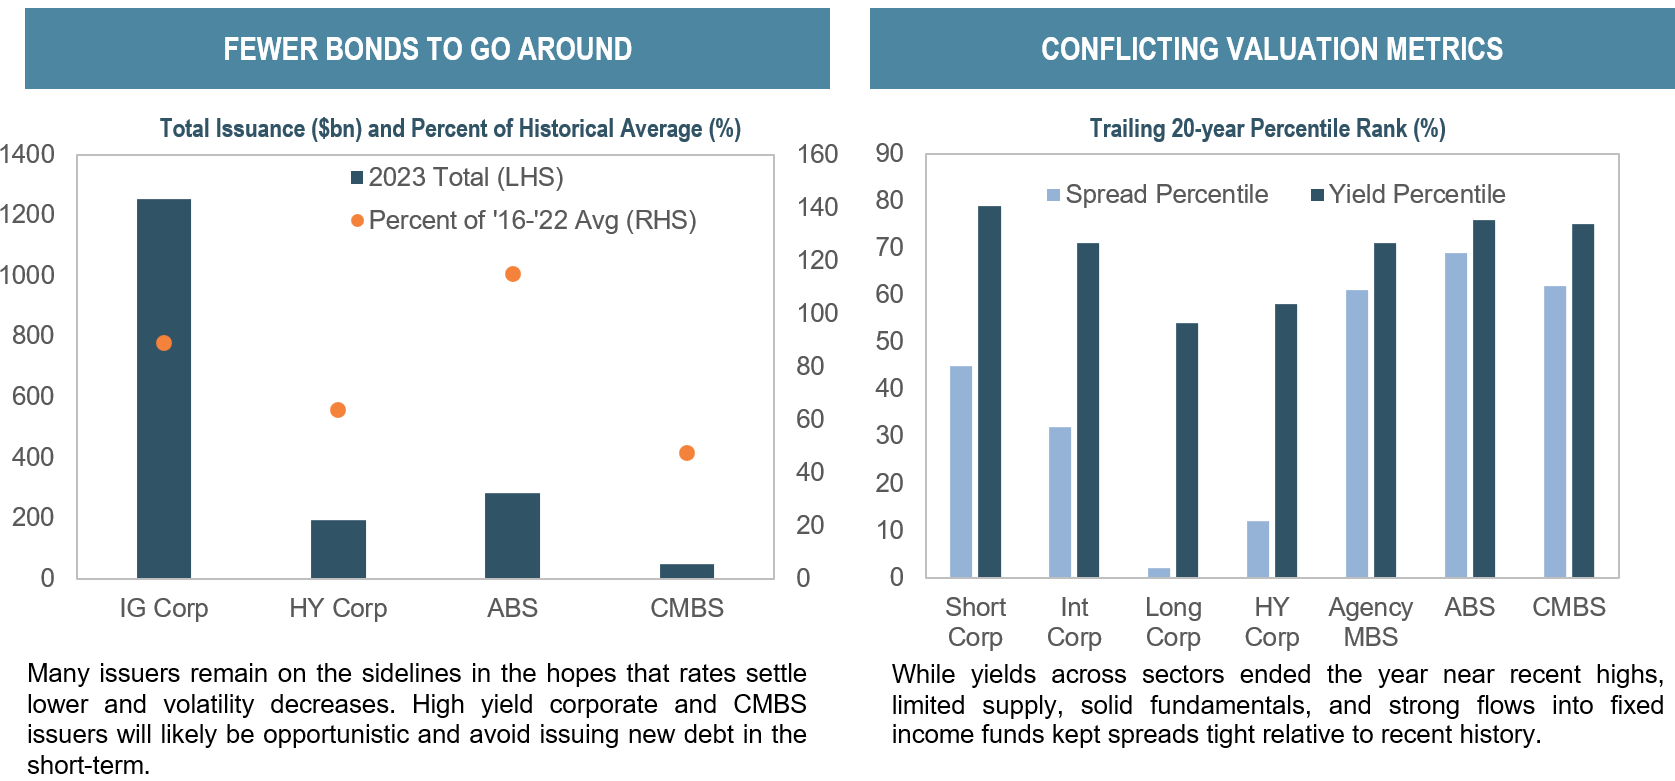
Today’s Standings – Top left chart: patterned bars represent which bucket the most recent month-end yield falls into. Top right chart: each category based on Bloomberg Indices (Short = Bloomberg 1-3yr Corporate Index, Intermediate = Bloomberg 3-10yr Corporate Index, Long = Bloomberg Long Corporate Index). Rate move needed to offset carry is calculated by dividing the yield to worst by the duration as of each month-end. Bottom left chart: sourced from Bloomberg as of 12/31/23 and are based on Bloomberg estimates of supply across those sectors. Bottom right chart: each category based on Bloomberg Indices (Short = Bloomberg 1-3yr Corporate Index, Intermediate = Bloomberg 3-10yr Corporate Index, Long = Bloomberg Long Corporate Index, Bloomberg US High Yield Index, Bloomberg US MBS Index, Bloomberg ABS Index, and Bloomberg CMBS Index, respectively). Percentile calculated using monthly spread and yields back 20 years.
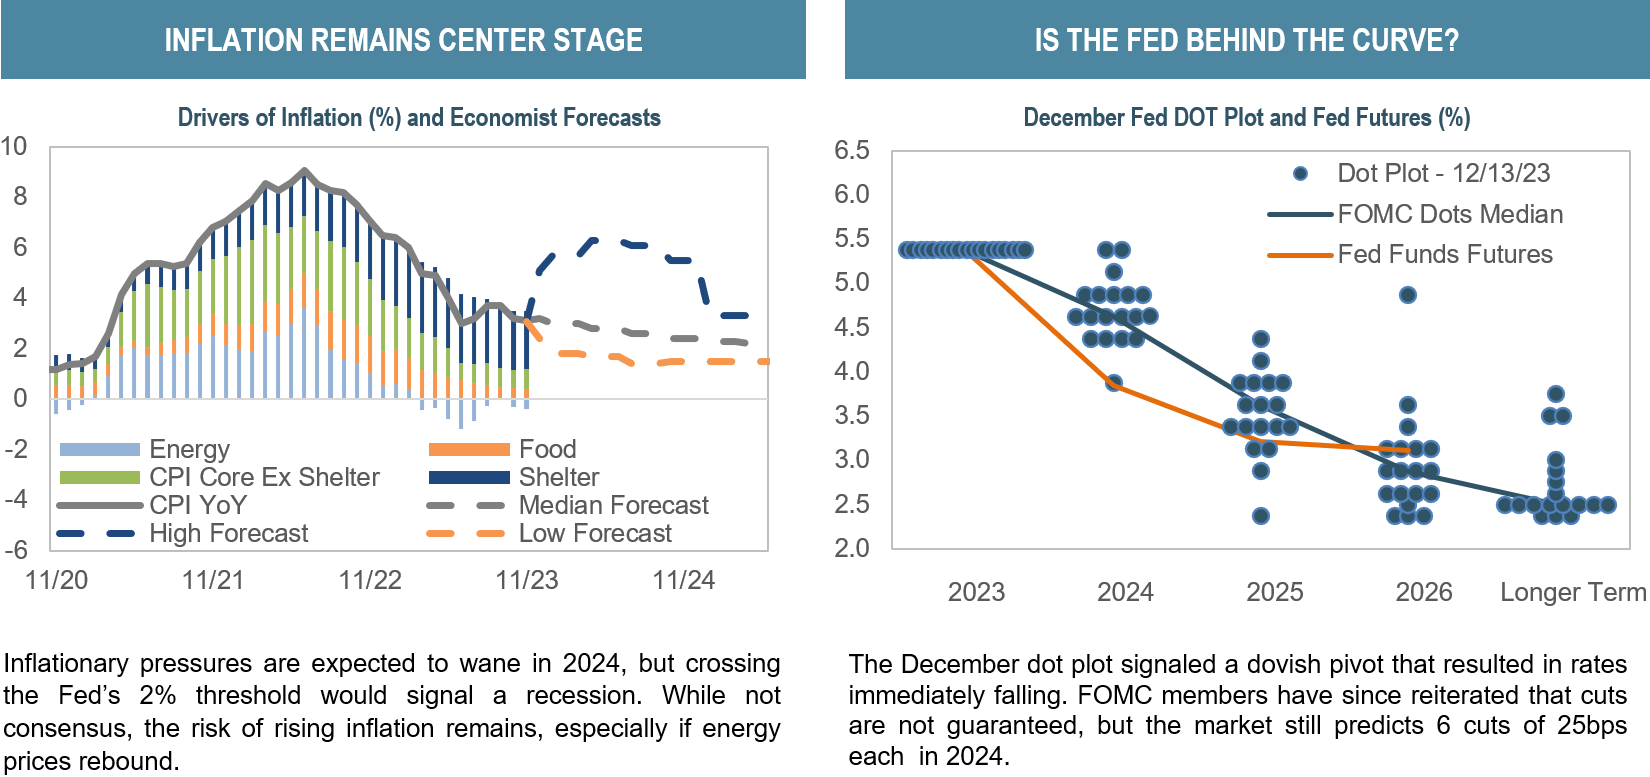
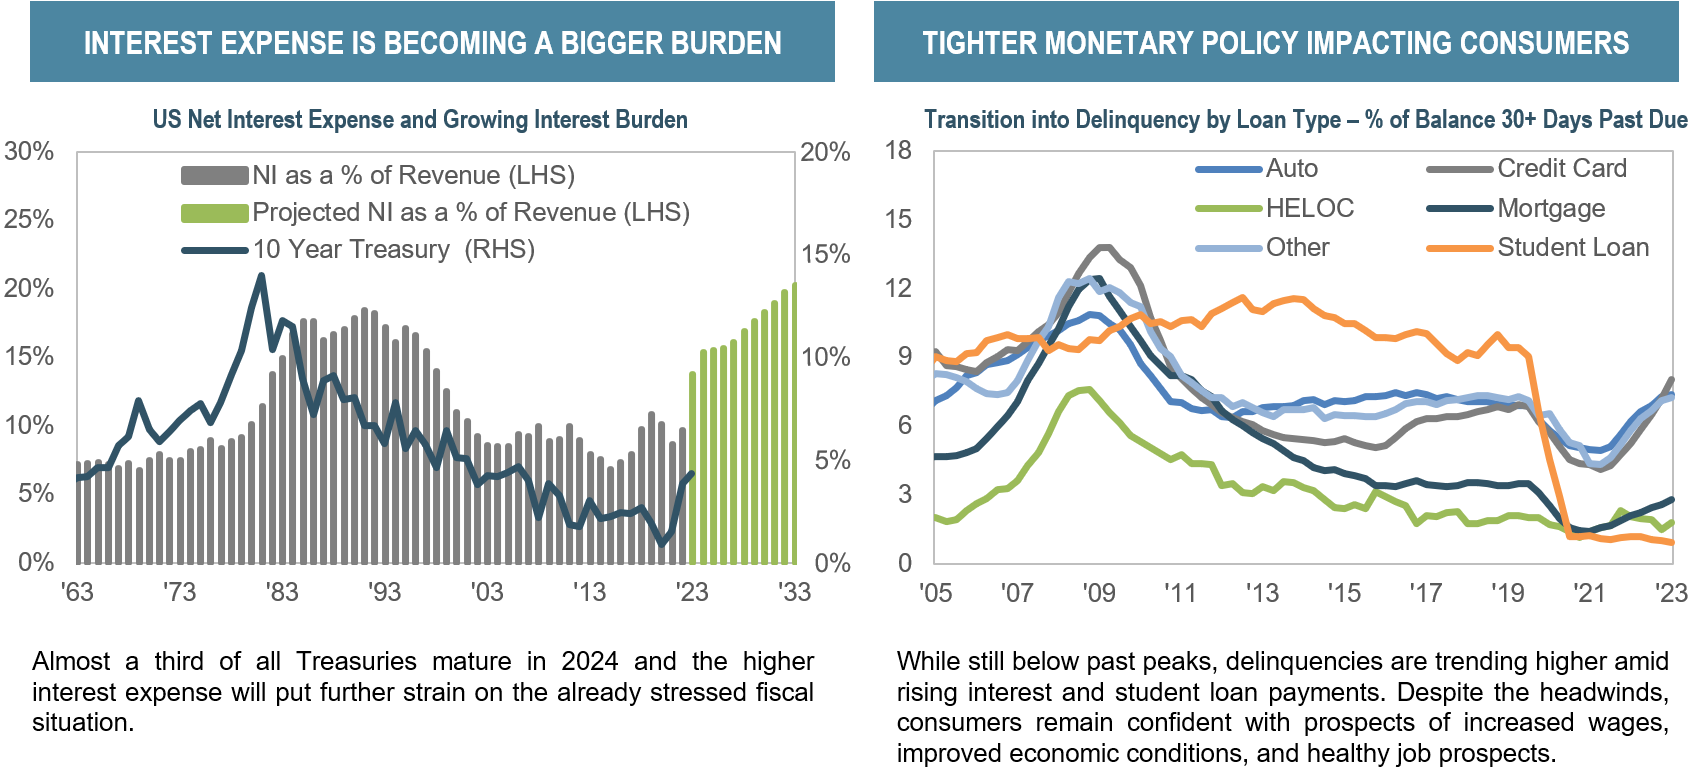
Previewing the 2024 Season – Top left chart: As of 11/30/23 but retrieved on 12/12/23; dashed grey line represents estimated median year-over-year change in CPI and the navy and orange dashed lines represent the high and low forecasted year-over-year change in CPI. Top right chart: Fed dot plot as of 12/13/23 FOMC meeting. Fed funds futures as of 12/31/23. Bottom left chart: Source: Congressional Budget Office data retrieved on 9/26/2023 and the 10 Year Treasury from Bloomberg as of 11/30/2023. Bottom right chart: sourced from Bloomberg as of 9/30/23. Other includes retail cards and other consumer loans.
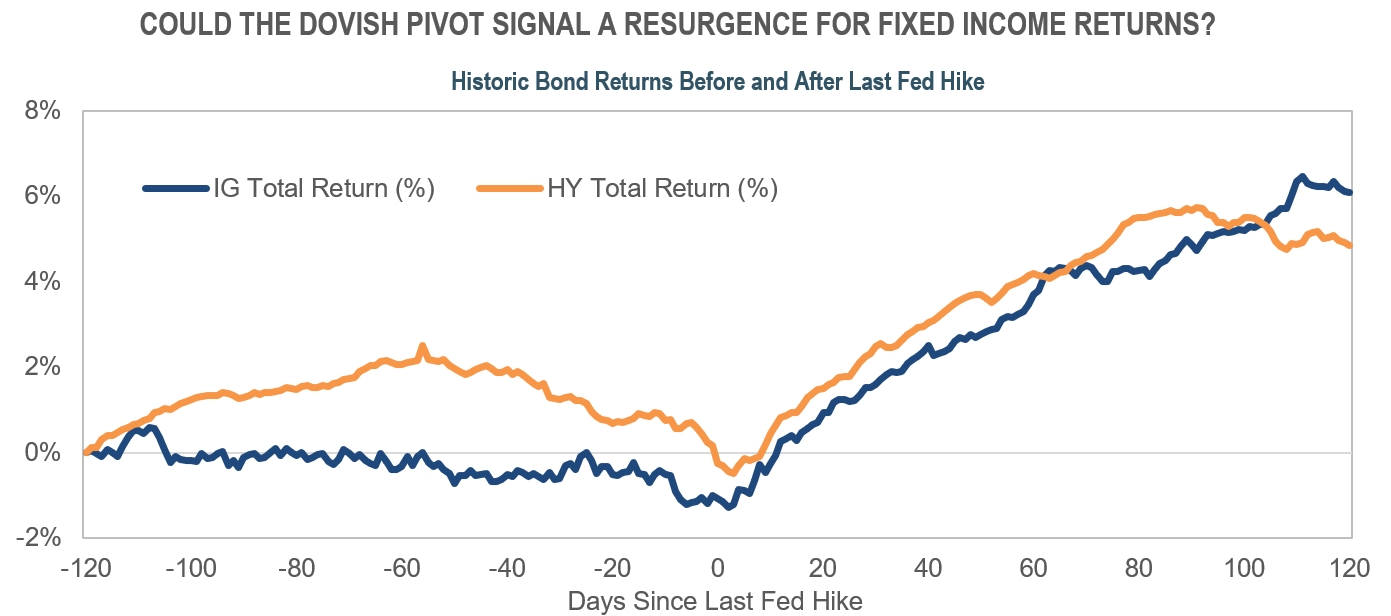
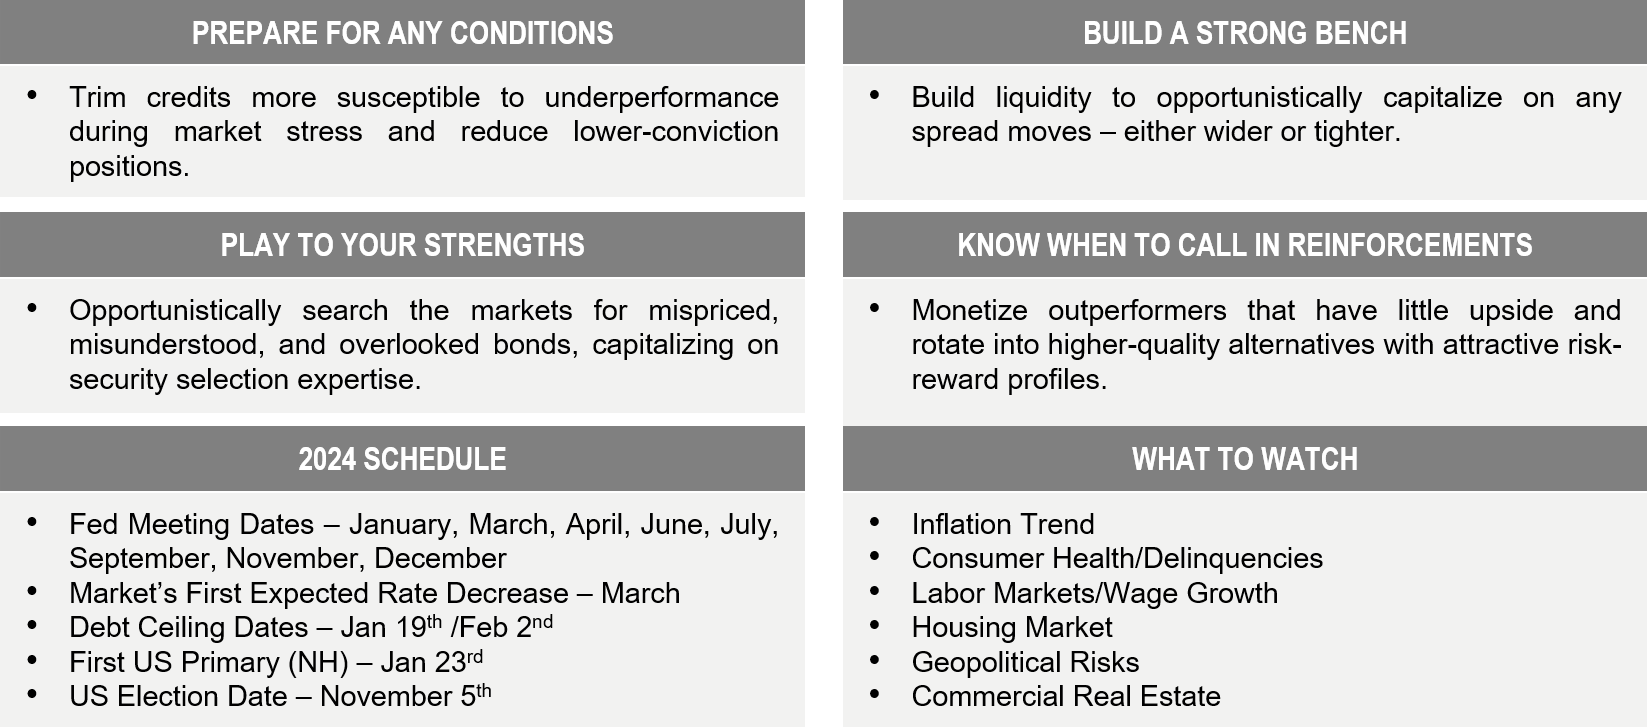
The IR+M 2024 Playbook – The above IR+M 2024 Playbook shows themes we feel are most prevalent across IR+M’s Broad Strategies in 2024 as of 12/31/23. Market conditions and opportunities could potentially change these themes. Top Chart: IG and HY total returns are based on the respective Bloomberg indices. Chart shows the average IG and HY total returns for the last three hiking cycles +/- 120 business days since last Fed hike. The views contained in this report are those of Income Research & Management (“IR+M”) and are based on information obtained by IR+M from sources that are believed to be reliable but IR+M makes no guarantee as to the accuracy or completeness of the underlying third-party data used to form IR+M’s views and opinions.
This report is for informational purposes only and is not intended to provide specific advice, recommendations, or projected returns for any particular IR+M product. Investing in securities involves risk of loss that clients should be prepared to bear. More specifically, investing in the bond market is subject to certain risks including but not limited to market, interest rate, credit, call or prepayment, extension, issuer, and inflation risk. “Bloomberg®” and Bloomberg Indices are service marks of Bloomberg Finance L.P. and its affiliates, including Bloomberg Index Services Limited (“BISL”), the administrator of the index (collectively, “Bloomberg”) and have been licensed for use for certain purposes by IR+M. Bloomberg is not affiliated with IR+M, and Bloomberg does not approve, endorse, review, or recommend the products described herein. Bloomberg does not guarantee the timeliness, accurateness, or completeness of any data or information relating to any IR+M product. IR+M claims compliance with the CFA Institute Asset Manager Code of Professional Conduct. This claim has not been verified by the CFA Institute. This material may not be reproduced in any form or referred to in any other publication without express written permission from IR+M.