One of my favorite children’s books, Paddle-To-The-Sea by Holling C. Holling, tells the tale of a miniature wooden canoeist set afloat near Nipigon, Ontario. The stoic hero circuitously drifts across The Great Lakes and up the St. Lawrence River — bobbing through storms, navigating down waterfalls, and maneuvering around ships. Eventually he reaches the Atlantic Ocean after a journey of over 2,500 miles and almost five years. While a bit fantastic, this unsinkable toy personifies resilience, endurance, and an undying spirit of progress. Oh, and the thing was made of buoyant wood, possessed inhuman patience, benefited from great craftsmanship, and had ample liquidity on its route. It turns out these same factors are more important than ever in today’s bond market.
High Grade Bonds are Naturally Buoyant
A bond’s mark-to-market risk from rate volatility increases as its yield cushion declines. But investors should remember that, at worst, this risk is temporal. First, duration exposure can still cut both ways (who’d have predicted that the Bloomberg Barclays Aggregate Index or “Agg” would be up 6+% YTD?). While the 10-year Treasury continues to stubbornly trade below 1.00% (as of this writing), the possibility of near-term negative returns can’t be ignored. Or can it?
Because bonds with de minimis credit risk steadily amortize or accrete towards par, the price impact from interest rate volatility is often greater over the short-run than the long-run. Figure (1a) plots the rolling 1-year returns on the Agg relative to its starting yield. Figure (1b) plots the same relationship, but for a rolling 5-year window. Clearly, the mark-to-market risk declines over time.
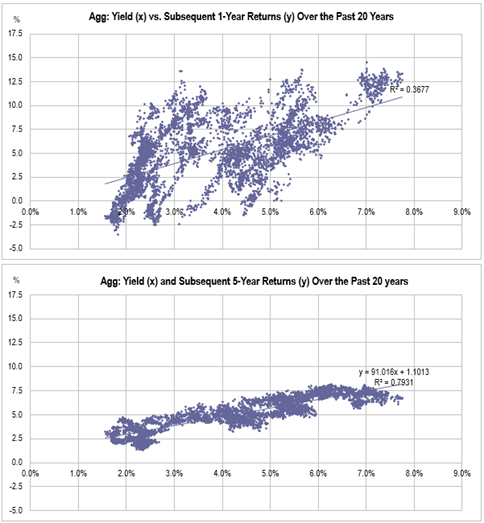
Figure 1a (top) and 1b (bottom)
Patience is the Remedy in a Bond Bear Market
But hasn’t the 40-year interest rate bull market helped bond returns? Yes, but your fixed income portfolio won’t necessarily sink for good if rates happen to rise relentlessly in the coming decades.
Why? Because bonds offer the opportunity to reinvest at higher yields. The additional accrued income gradually overcomes the mark-to-market erosion from rising interest rates if investors are patient. In the third edition of their seminal fixed income tome, Inside The Yield Book, Liebowitz and Homer (with Bova and Kogelman) mathematically demonstrate, that, even in the most adverse rising rate scenario, investors with a time horizon of twice the portfolio duration or longer will be better off than in a less onerous rising rate scenario. Figure 2 demonstrates this for a hypothetical bond portfolio benched against the Agg. Clearly, when mark-to-market hurts, reinvestment benefits can heal with time.
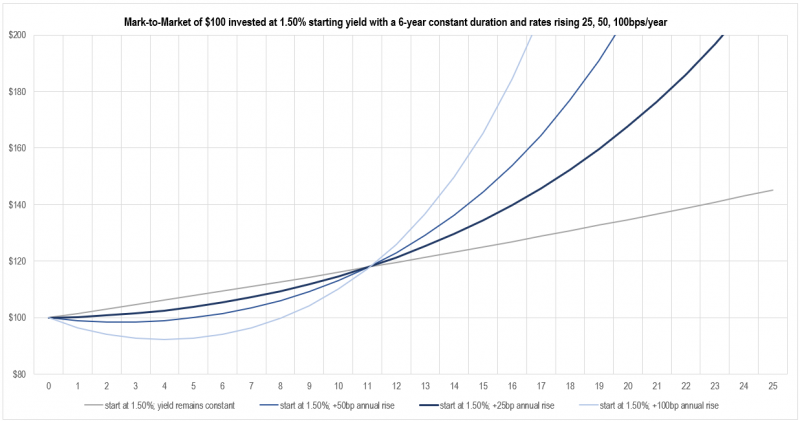
Figure 2: Growth of $100 over 25-years starting at 1.5% and rising in various degrees over time
Good Craftsmanship from Active Management is Even More Important Today
Outperforming an investment-grade benchmark by 50-75bps each year is certainly a positive. But it counts even more in a low yield environment. Why? Because the compounding from the incremental returns contributes proportionally more to portfolio growth.
Let’s look at the difference between two hypothetical portfolios over a 25-year time horizon – one with annualized returns of 1.25% and another with 1.75%. A 50bps return advantage accrued over this timeframe results in a portfolio that is 13% larger. That percentage is constant regardless of the benchmark yield. However, the percentage of dollars from those incremental returns will be higher at lower yields. Imagine you’d like to seed a bond portfolio such that it grows to $100 over 25 years. Let’s say that in a low yield environment (like this one), you can either invest in a passive bond strategy that returns 1.25% or an active one that returns 1.75% each year. In a high yield environment, your choice is annualized returns of 5.00% or 5.50% each year. Although all grow to $100 in 25 years, the additional 50bps annually in the low yield environment requires proportionally less seed capital in the fixed income allocation, whereas in the high yield environment, that difference in seed capital is smaller. If we do have a lower for longer yield environment, even mostly better returns generated by active management can get substantially more out of your fixed income allocation.
Active Managers Should Balance Yield with Liquidity
But what about liquidity? Don’t passive bond strategies provide the most? Perhaps, but the Agg represents less than half of the almost $50 trillion dollar-denominated investment-grade fixed income universe outstanding. The U.S. Treasury component currently comprises 36.8% of its market value (a figure expected to grow) and offers 60bps of yield as of this writing. Although March reminded us that liquidity is a critical consideration in fixed income, plenty of high-grade sectors offer ample liquidity at better yields than Treasuries. In fact, the Federal Reserve now traffics in four sectors (Treasuries, TIPS, MBS, and corporates), which bolsters confidence that yield need not be sacrificed to maintain liquidity. While active managers should monitor liquidity conditions, they need not hug the benchmark to have it in the portfolio.
Conclusion
If you’re worried about the direction of long-term interest rates and liquidity conditions, these considerations should provide a route to a better understanding. Patience is key. Portfolios constructed from income and liquidity-producing alternatives to benchmark constituents is also key. No one holds a crystal ball, but the beauty of high-grade fixed income is that with enough time, it isn’t necessary. How many other asset classes can claim that?