![]()
- The Federal Reserve (Fed) delivered another rate cut in December, bringing the target rate range to 4.25% - 4.50%; both equity and bond markets stumbled as Chair Powell signaled a cautious and measured approach to rate cuts in 2025
- A resilient labor market supported the Fed’s stance, with the growth in nonfarm payrolls surpassing expectations in November at 227,000
- On the other side of the Fed’s dual mandate, inflation continues to be a concern, as November’s CPI and PCE reports showed 2.7% and 2.8% year-over-year increases, respectively – still above their 2% target
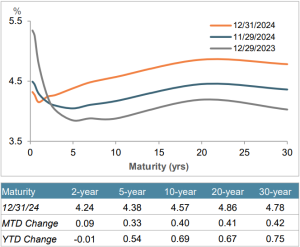
- The Treasury yield curve steepened, with short-term Bill yields dipping and longer-term Bond rates climbing higher; the 10-year yield increased by 40bps on the month to end the year at 4.57% – 69bps higher than its 2023 closing level and 87bps higher since the Fed began its cutting cycle
- The basis between the 2-year and 10-year Treasury yields increased by 31bps over the month to 33bps, the steepest point since May 2022
- Investment-grade issuance in December reached $41 billion, exceeding dealer expectations for yet another month this year and pushing 2024’s total issuance to $1.5 trillion – a 26% increase year-over-year; the high-yield market added $12 billion to its tally of new bonds and ended the year with nearly $279 billion in new issues priced
- Dealers forecast $1.4-1.9 trillion and $290-400 billion of new high-grade and high-yield supply, respectively, in 2025
- Investment-grade corporate spreads widened by 2bps to 80bps, but still well below long-term averages, while high-yield spreads widened by 21bps to 287bps; yields rose by 28bps in the high-grade market and by 35bps in the high-yield market, ending at 5.33% and 7.49%, respectively
- Mortgage-backed securities (MBS) were pressured as rate volatility picked up, but still achieved their second consecutive year of positive total returns; the sector continues to face headwinds, with lighter bank demand expected in 2025
- Municipal markets faced a shift, as fund flows turned negative with a $222 million outflow, breaking a 19-week streak of net inflows; muni/Treasury ratios increased across the curve
- Municipal issuance in December topped $32 billion, bringing the annual total to $527 billion and marking a notable 37% increase over the amount issued in 2023
![]()
Treasury Yield Curve
MTD Returns