Our annual analysis of insurance company filings examines trends and changes that occurred in insurance companies’ investment portfolios during 2022. Insurers were impacted during the year by the sharp increase in interest rates and negative returns from risk assets. While most investors were anxious to turn the page on 2022, insurers will likely benefit from higher rates in the years ahead. Within this piece, we also highlight potential investment opportunities that insurance companies can uncover in this new investment landscape.
2022 Allocation Lookback
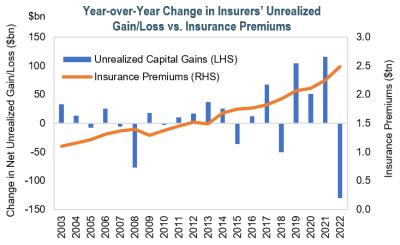
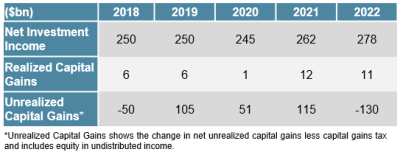
- Given the sharp rise in interest rates and lower equity prices, insurers are now faced with an additional $130 billion in unrealized losses. As a result, insurers may experience potentially meaningful consequences should they implement changes to asset allocations.
- Despite broad volatility across markets in 2022, insurance industry assets still grew $141 billion, or 1.9% year-over-year, to $7.6 trillion, due to strong premium growth.
- Given the shorter duration nature of their portfolios, Property & Casualty (P&C) and Health companies net investment income benefited from the recent increase in rates and grew by one of the highest amounts on record. Despite higher new money yields, net investment income within the life space was lower as a result of variable interest
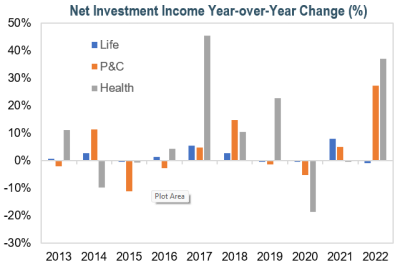 income decreasing, their longer duration portfolios, and legacy higher book yield securities rolling off.
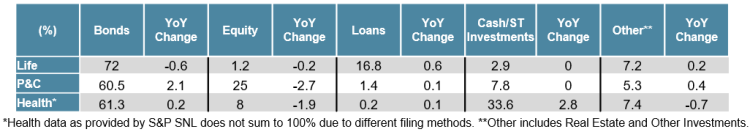
 - Most insurers were likely limited by the large unrealized losses in their portfolios and overall asset allocation shifts were small and on the margin. For the first time since 2018, P&C companies’ fixed income allocations increased, and equity allocations decreased. This was likely driven by weak equity performance in 2022 and fixed income assets being carried at book value.
- Health insurers saw an increase to cash/short term investments last year in order to build up liquidity given the cost to access new capital was rising with rates.
Fixed Income Observations
- Unsurprisingly, fixed income allocations remained relatively stable year-over-year, as record unrealized losses limited any incentive to make a meaningful allocation shift.
- Overall credit quality based on the National Association of Insurance Commissioners (NAIC) designations improved in 2022. Given the higher rate environment, insurers were able to improve book yield without having to reach for yield by sacrificing credit quality. Insurers are positioning themselves more defensively by improving the overall credit quality of their fixed income portfolio ahead of a potential looming recession which could lead to ratings deterioration and higher risk-based capital charges.
- Allocations to privately placed bonds as a percent of total bonds reached an all-time high across insurance company types. While P&C companies’ allocations to privates grew at the lowest rate since 2005, life companies’ allocations to private assets grew by the highest rate.
Fixed Income Observations Spotlight: Book Yields – Finally Start to Rise for P&C and Health Companies
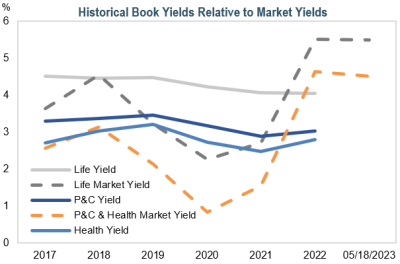
- P&C and Health companies finally started to see some benefit from higher rates as book yields on their fixed income portfolios increased by the greatest amount on record.
- Despite the significant rise in rates, fixed income book yields for life insurance companies moved slightly lower on the year.
- At current market yields, reinvestment rates continue to be higher than current book yields on bond portfolios, thus insurers should be able to reinvest cash flows at higher rates.
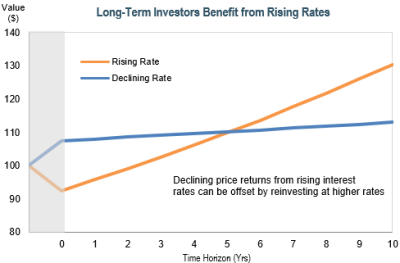
- Insurers can benefit from higher reinvestment rates, especially those with time horizons longer than their durations, as the coupon income can offset the negative price return over the long term.
- In this environment, we believe insurers should continue to consider relative value trades to allow for improvement in book yield and potential future total return. For insurers with adequate capital and Risk-Based Capital (RBC) ratios, incurring modest levels of losses today to reinvest and improve income in the future could be beneficial.
IR+M’s Take On 2023 & Opportunities in the Current Market Environment
- As we transition from the fastest pace of rate hikes historically to an environment of stabilizing rates, we believe there are ways we can partner with insurers to further optimize their investment portfolios.
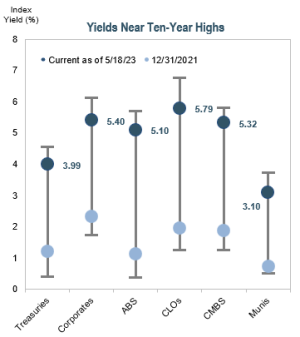
- Yields have risen on average1 338bps since 12/31/21 and remain well-above both the trailing 5- and 10-year averages across corporates, municipals (munis), and the securitized sectors, which presents opportunities.

- Corporates: Front-end spreads remain wide to long term averages, whereas long-end spreads are tight to historical metrics which presents opportunities for shorter securities. Credit fundamentals are diverging amid a backdrop of uncertainty creating larger pricing deviations amongst issuers and therefore greater opportunities for security selection.
- Convertible Bonds: Higher rates are beginning to bring convertible debt issuance back to the market for the first time since COVID. This expansion presents opportunities for insurers to increase their allocations within the convert space, potentially adding equity exposure in a more capital-friendly manner.
- Munis: Despite yields nearing 5- and 10-year highs, a lack of supply continues to keep muni/Treasury ratios inside of long-term averages. With tax equivalent yields for munis at 3.69% as of 4/30/23, the asset class offers meaningfully less income potential than the 5.14% offered in a comparable duration corporate alternative. We continue to see greater opportunities outside the asset class, but if recent weakness in the longer duration segment of the tax-exempt market persists, it could create select buying opportunities.
- Securitized:
- Asset-Backed Securities (ABS): We see pockets of opportunities in both traditional and off-the-run ABS but also exercise caution in select areas of the market. Extension concerns and increasing capitalization rates make refinancing increasingly risky and could lead to some assets no longer presenting economic benefits to owners. As we apply this risk into our investment framework, we favor sectors like Franchise ABS over sub-sectors like Data Center and triple-net lease given the reliance on long lease payments with low rent escalators to ultimately pay-back bondholders in event they are unable to refinance.
- Collateralized Loan Obligations (CLOs): We believe CLOs provide attractive relative value, particularly within the AAA-rated tranches. The structural strength of CLOs has proven out over multiple credit cycles and the floating nature of CLOs should shield insurers should rates continue to drift higher. We are closely monitoring the CLO RBC discussions at the NAIC, though we anticipate little impact to the highest tranches.
- Commercial Mortgage-Backed Securities (CMBS): Amid present market concerns around CRE, we believe CMBS spreads offer a meaningfully attractive entry point, however, security selection and credit analysis must be heavily emphasized. Seasoned securities with low office exposure, favorable geographic footprints, and high levels of defeasance offer attractive risk/reward characteristics. As investors within the AAA-tranche, our primary concern is around extension risk, not principal loss given the strength of the structure and significant credit enhancement that can build as a deal seasons and de-levers. Understanding potential extension risk is top of mind and a key part of our valuation framework when assessing potential investment opportunities within this sector.
- Asset-Backed Securities (ABS): We see pockets of opportunities in both traditional and off-the-run ABS but also exercise caution in select areas of the market. Extension concerns and increasing capitalization rates make refinancing increasingly risky and could lead to some assets no longer presenting economic benefits to owners. As we apply this risk into our investment framework, we favor sectors like Franchise ABS over sub-sectors like Data Center and triple-net lease given the reliance on long lease payments with low rent escalators to ultimately pay-back bondholders in event they are unable to refinance.
At IR+M, we believe the current environment of higher yields and stabilizing rates presents investment opportunities for insurers to improve portfolio quality and book yield. We believe that bottom-up security selection is paramount in this environment, as broader economic challenges continue to emerge. Through our experience managing high quality fixed income portfolios and partnering with insurance clients, we think we are well-positioned to help fulfill investment needs across a variety of rate and spread environments, while optimizing book yield and limiting financial statement volatility.