
 Every four years, the world trains its sights on the international phenomenon that features triumph and heartbreak – the Summer Olympic Games. As bond-letes for Team IR+M, we compete daily in the US Fixed Income Games, leaping over hurdles, flexing our research muscles, and fighting to climb the medal stand.
While Paris 2024 kicks off on July 26th, US Fixed Income 2024 is well underway, and the competition is heating up. As we settle into the second half of 2024, we review the first half highlights and preview the events to watch.
The Torch Has Been Lit (What Has Happened Thus Far in 2024)
- Investor expectations whipsawed from six 25bp cuts to just two possible cuts in 2024. Initially, investors feared that tight monetary policy would tip the US into a recession. However, market participants have quickly reduced the number of expected cuts amid signs of a resilient economy and labor market.
- The Fed reiterated patience. With the Fed’s heightened focus on economic data, investors recognized that positive data implied that rates would remain “higher for longer.” The intermediate- and long-end of the Treasury curve repriced and increased 30 to 60bps, as the economy remained resilient, and inflation elevated.
- Yields drove demand. Through June 2024, taxable fixed income fund inflows totaled over $218 billion, with investors adding to the asset class in 25 out of 26 weeks. The heavy demand kept corporate spreads relatively tight – trading below 100bps for over 115 trading days – despite supply reaching the second highest first-half total on record.

Opening Ceremonies (Where We Are Today)
- Inflation remains stubbornly high. Over the last year, CPI ranged from 3.0% to 3.7%, far from the Fed’s desired 2.0%. More recently, it has begun trending lower, mostly driven by consumer goods’ falling prices. However, service price pressures still need to soften further – and that requires lower labor costs and service-sector demand.
- The economy is still growing, albeit at a slower pace. While first quarter GDP was revised upward to 1.4%, it was still down from 4.9% and 3.4% in Q3 ‘23 and Q4 ‘23, respectively. Labor market strength, coupled with supportive fiscal policies, has buoyed growth and should continue to provide a tailwind.
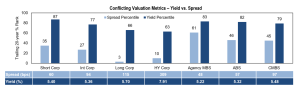
- Valuations are mixed. Yields, which are the primary driver of long-term returns, remain attractive across fixed income sectors. While spreads are less compelling, there is ample opportunity for skilled bottom-up investors, and demand for fixed income continues to be robust.
Medal Count (Year-to-date Sector Performance)

TV Timeout (10 Olympic Fun Facts & Figures)

The Dark Horses (What We Are Watching)
Inflation could move higher before going lower.
The Fed will likely cut rates before inflation reaches 2%. If their preferred measure of inflation, PCE, follows recent trends – which are in-line with Fed expectations – optically, it could appear counter to progress. “Bad news” has been “good news” as we approach the first rate cut, but “bad news” could mean “bad news” if economic data becomes much weaker and spark volatility.

The US debt burden is growing.
The US fiscal situation continues to worsen with no apparent easy solution. Interest expense is quickly becoming one of the largest Government expenditures due to higher rates and Treasury issuance. Treasury debt could be on an unsustainable path longer-term, but the US position within the global financial system will likely delay any immediate consequences.

Honorable mentions: Election (could cause increased volatility), Consumer Health (delinquencies increasing), Geopolitical Conflicts (Ukraine/Russia, and Israel/Hamas ongoing), and Liquidity (an unforeseen event could cause liquidity to dry up fast).
With the second half of 2024 underway, the US Fixed Income Games’ closing ceremony and official medal count are still in the distance. Anticipation is mounting and outcomes are far from certain. The market continues to be intrigued by fiscal and monetary policy divergence across sectors, and the Fed is at a crossroads. While economic and inflationary pressures are subsiding, the Fed could ignite growth if it acts too quickly. At IR+M, we pride ourselves on our athleticism and flexibility, which allows us to adjust portfolios based on the field at play. In this environment, we favor durable and defensive yield across sectors versus securities whose outperformance depends on meaningful spread tightening. Momentum can abruptly shift, and as a result, we have ample liquidity and dry powder to take advantage of any market dislocations.