
Fixed Income Market Pulse – October 2026

2 min read
Share this post
Printable Version

3Q26 Market Themes + Outlook


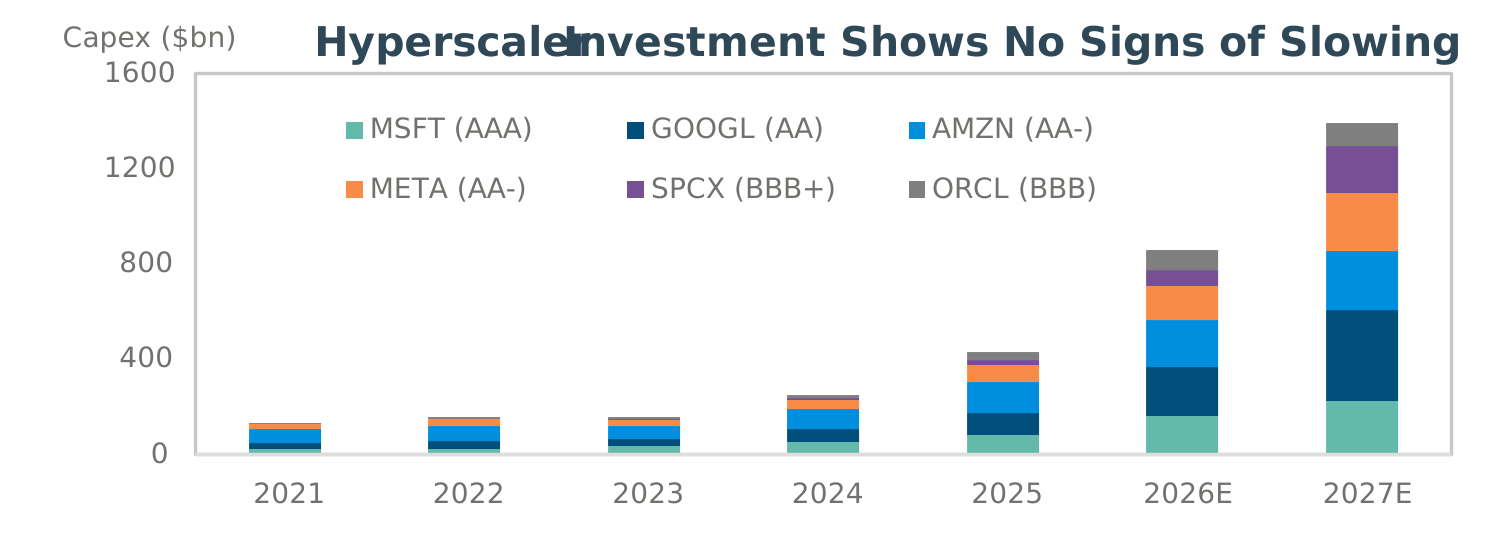
  • The US economy continued to expand, supported by steady employment, resilient consumer spending, strong corporate earnings, and AI-related investment.
  • Persistent inflation and geopolitical risks tested that strength as the US-Iran conflict entered its seventh month.
  • Citing ongoing price pressures, the Fed tightened the policy rate, the first policy action since cutting in December 2025.
  • Interest rate volatility rose as the market repriced the expected Fed path amid elevated inflation, fiscal supply, and solid growth.


Taxable Market Insights


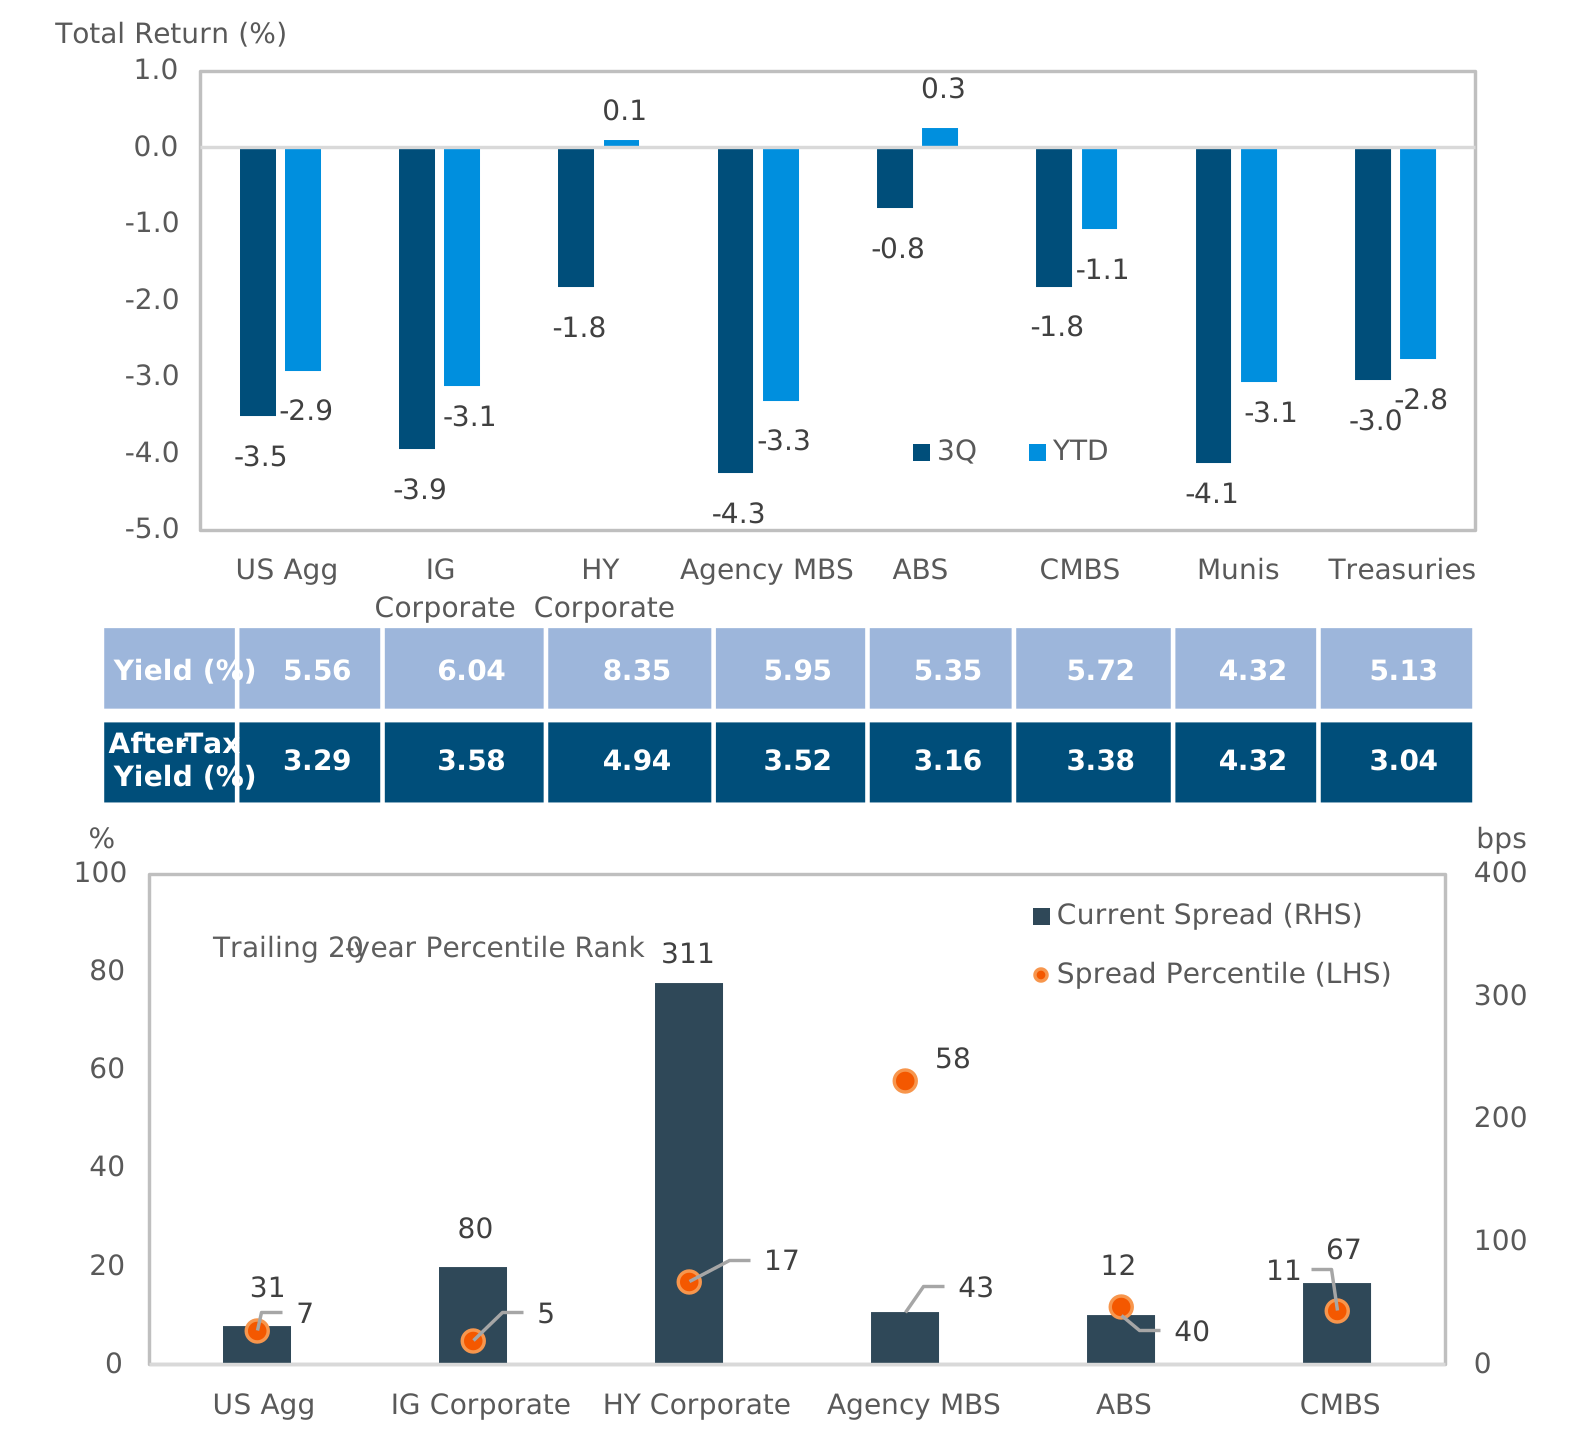
  • Investment-grade corporates remained resilient despite rising rates, supported by solid fundamentals, persistent fund inflows, and strong investor demand. The Fed increased the federal funds target range by 25bps, its first policy action since December 2025, while record monthly issuance pushed quarterly supply above $509 billion. Softer sentiment late in September drove short corporate spreads wider from 42bps to 51bps.
  • Securitized sector performance was mixed as higher rates and increased volatility weighed on longer-duration assets. ABS outperformed given its shorter-duration profile and limited credit concerns, while attractive carry and stable fundamentals supported non-agency CMBS. Agency MBS underperformed Treasuries as rising rates, greater volatility, and the prospect of additional duration extension weighed on relative performance.


Tax-Exempt Market Insights


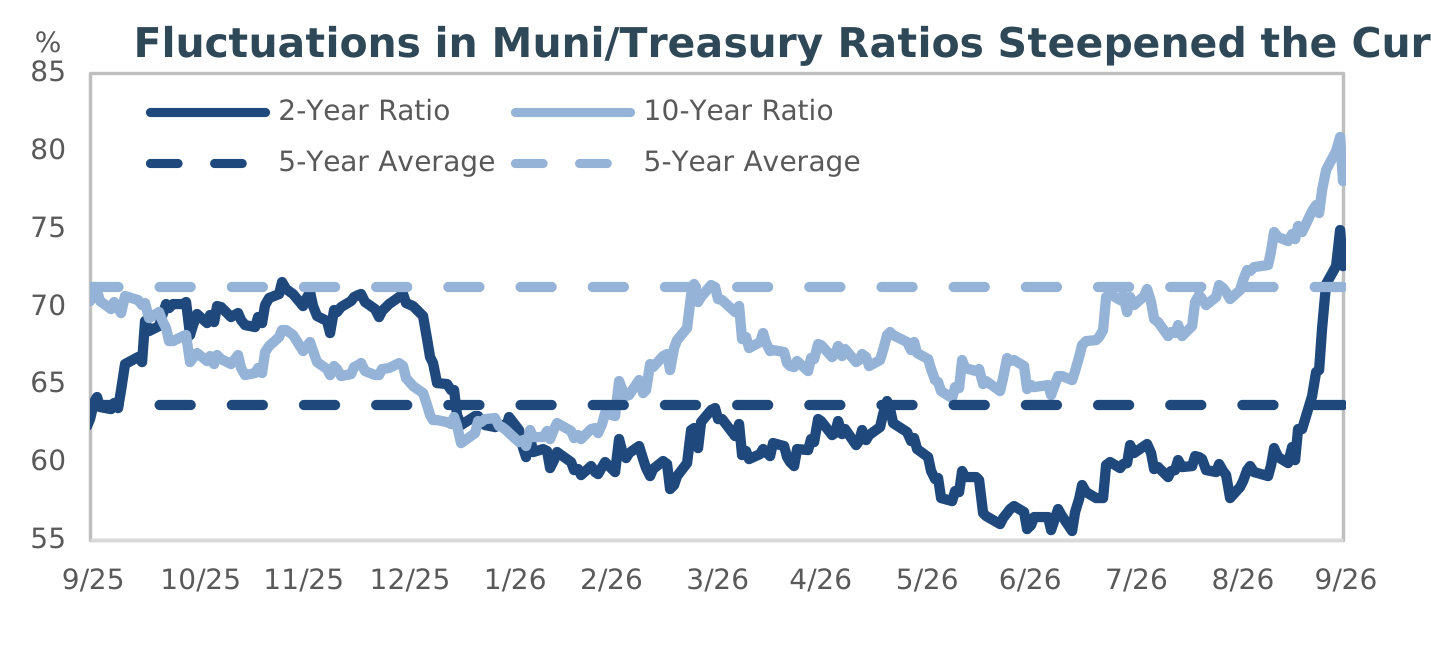
  • Tax-exempt municipals experienced significant volatility during the third quarter, as rising Treasury yields drove 10-year AAA muni yields 124bps higher. Underperformance accelerated in September, pushing the 10-year Muni/Treasury ratio from 71% to 78%.
  • Municipals offered increasingly attractive relative value, with 10-year AAA yields reaching their highest level since 2008. Housing and healthcare remained particularly compelling areas of relative value.



Sources: Bloomberg and J.P. Morgan Research as of 9/30/26, unless otherwise noted. Top left: Returns, yields, and spreads are from the respective Bloomberg indices. After-tax yields assume the highest federal marginal tax rate of 40.8%. Top right: 2026 and 2027 Capital Expenditure Estimates are based on JP Morgan estimates sourced from Bloomberg. Bottom left chart: Spreads are from the respective Bloomberg indices. Percentile calculated using monthly spread going back 20 years. References to market, economic, and investment topics are IR+M views based on information obtained by IR+M from sources that are believed to be reliable and are for educational purposes only. They are not intended as investment advice or a recommendation regarding any specific security, strategy, or investment approach. Past performance is not indicative of future results. Actual results may vary. No part of this material may be reproduced in any form, or referred to in any other publication, without express written permission from IR+M. “Bloomberg®” and Bloomberg Indices are service marks of Bloomberg Finance L.P. and its affiliates, including Bloomberg Index Services Limited (“BISL”), the administrator of the index (collectively, “Bloomberg”) and have been licensed for use for certain purposes by IR+M. Bloomberg is not affiliated with IR+M, and Bloomberg does not approve, endorse, review, or recommend the products described herein. Bloomberg does not guarantee the timeliness, accurateness, or completeness of any data or information relating to any IR+M product.

Share this post

Related posts

View All
6 min read

Bond Appétit - The Active Manager's Discerning Palate

4 min read

The Next Hundred Days and Beyond

3 min read

Cashing In On Your Second Chance

As of 6/30/26 unless otherwise stated. Personnel Data as of 8/24/26.
@ 2026 Income Research + Management. All Rights Reserved.
chevron-down