Record-high equity prices over the last year helped push the funded status of pension plans higher, with our Average Plan funded status increasing by over 10% to 106.1% in 2021. Funded status gains of this magnitude lead many plan sponsors to consider de-risking by moving from growth assets to hedging assets. However, some have concerns with adding to or maintaining large corporate bond allocations. Long-duration securitized bonds can be an attractive strategic or tactical allocation for pension plans interested in de-risking without adding corporate exposure. In this piece, we discuss benefits and drawbacks to introducing securitized bonds, particularly long-duration collateralized mortgage obligations (CMOs), into an LDI solution.
Thinking Inside the Benchmark
- Corporate defined benefit (DB) plan sponsors traditionally consider their discount curves when constructing LDI portfolios. Plans often calculate the present value of their liabilities using discount rates based on high-quality, mostly AA-rated corporate bonds. To reduce funded status volatility, many plans invest large portions of plan assets in long corporate bonds aligned with liability durations.
- However, the AA-rated long corporate universe is highly concentrated and practically uninvestable. There are only 74 issuers in the Long Corporate AA-rated Index, with the five largest issuers accounting for almost 50% of the index. Nearly half of the issuers have less than $1 billion of debt outstanding. A low number of issuers can expose plans to much larger positions than they would otherwise feel comfortable owning.
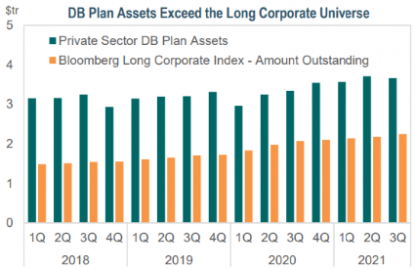
- Pension demand may outpace long corporate supply. Estimates put the total size of private sector DB plans at roughly $3.7 trillion, whereas long-duration investment-grade corporates total approximately $2.3 trillion (of which pensions $1.1 trillion are rated A or better). As we discussed here, pensions are not the only buyer of long-duration debt as domestic and foreign insurers are also investors.
Expanding the LDI Toolkit
- Investing outside the high-quality long corporate universe can improve diversification. The securitized market, at over $8 trillion, offers high-quality alternatives to corporate credit. Collateral types vary and investors can select structures that best align with their LDI strategy.
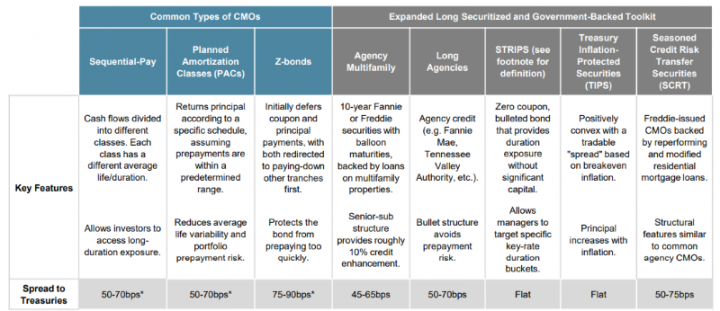
- Collateralized mortgage obligations (CMOs) are the most common long securitized sector. We estimate the long-duration CMO market to be roughly $100 billion in size. We believe this offers a more than adequate opportunity set for active managers to select securities with desirable structures and underlying collateral. The rest of the securitized universe, including agency mortgage-backed passthrough securities and traditional asset-backed securities (ABS), is primarily intermediate- or short-duration, which can be useful to plans with shorter duration needs.
- CMOs can be selected to meet the unique objectives of a long-duration portfolio. They are created from pools of mortgage-backed securities that have been divided into tranches with different weighted-average lives. The characteristics of each tranche can differ with each having a distinct duration, yield, coupon, and price.
- At IR+M, we favor issues with stable cashflows resulting from underlying loan characteristics or the CMO structure itself, such as Planned Amortization Classes (PACs) or Z-bonds. While this piece focuses on Long CMOs, other agency-backed sectors and longer-duration tranches of ABS and commercial mortgage-backed securities (CMBS) can further diversify a long-duration securitized toolkit.
Watchouts
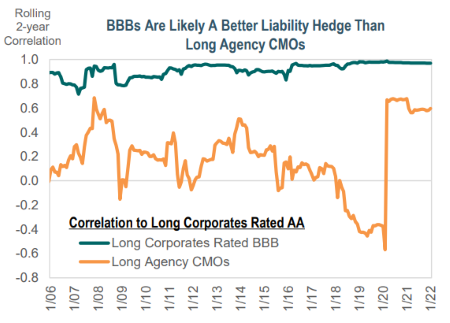
- Long CMOs are not a perfect liability hedge. The sector is less correlated to AA-rated long corporates than A-rated and BBB-rated corporates. This could prove to be more costly for late-stage plans that are planning for hibernation or termination. The underlying collateral and performance drivers differ from corporates, and while providing diversification, can also create asset-liability tracking error.
- CMOs may create duration mismatches. The prepayment risk of mortgage-backed securities (MBS) causes the securities to be less convex than comparable Treasuries because investors would receive their investment back at an inopportune time (when interest rates are low). Pension liabilities, however, are positively convex. Shortening durations from prepayments can create unwelcome duration mismatches against a plan’s positively convex liabilities as interest rates change.
- Liquidity varies. Many long CMOs get tucked away into investor portfolios for long periods of time, similar to long corporates held by insurers. The investable universe is also much smaller than long corporates, which makes the sector inherently less liquid. For comparison, we estimate roughly $5 billion of CMOs trade per month, while over $125 billion of long corporates traded monthly over the last year. The limited liquidity can be costly for plans interested in terminating in the near-term, as it could take longer to liquidate and/or an insurer may choose not to take the bonds in-kind.
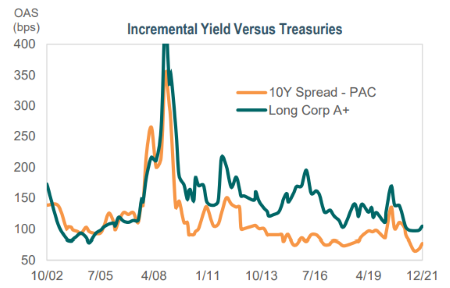 Long Agency CMOs currently yield less than high-quality corporates. The tighter spread level may reduce the overall yield of the LDI portfolio below that of the single effective discount rate of the liabilities. This discount rate can be thought of as the “investment hurdle” that is needed to keep pace with liability returns. Having a yield below that can contribute to negative relative returns. Investors must evaluate whether relative value is compensatory for the high-quality and diversification benefits but lighter liquidity and higher asset-liability tracking error.
The Missing Puzzle Piece?
- Long Agency CMOs offer more yield than Treasuries with similar credit quality. Treasuries are often used to diversify corporate allocations, however, may appear less attractive relative to long CMOs. Long securitized bonds are a “middle ground” between the two sectors, increasing diversification and yield (as noted in the “Expanded Securitized Toolkit” above); investors in long CMOs can pick-up approximately 70bps of yield versus similar-duration Treasuries.
- The majority of the long securitized universe is rated AAA and carries an implicit or explicit government guarantee. Liability discount curves are immune to downgrades and defaults. Impacted securities are removed from the liability discount rate calculation, typically resulting in a lower discount rate, whereas downgraded/defaulted securities typically lose value in a fixed income portfolio, negatively impacting funded status. The inherently high-quality nature of long securitized debt mitigates credit risk and accompanying funded status volatility.
- Structural differentiation allows for security selection opportunities. The main risk associated with agency CMOs is prepayment risk; when an investor will be paid, not if the investor will be paid. At IR+M, we analyze the underlying loans to determine the stability and predictability of the cash flows. We favor bonds backed by loans with certain loan balances or FICO characteristics, such as residential mortgages with low loan balances. These features make the prepayments more predictable. Investors can approach a dealer to create a longer-duration CMO backed by specific collateral, but if the dealer is unable to easily sell the accompanying shorter tranche(s), it may come with a lower yield to move forward with the special order.
- There are ways for investors to improve convexity. Investors can also choose from different classes when purchasing CMOs, some of which can limit the prepayment volatility. Two common classes used in long-duration portfolios are PACs and Z-bonds. Given the lower prepayment risk of these classes, the yield is typically lower than a sequential CMO. Another option is to use derivatives such as Treasury futures to complete portfolios against liabilities and limit the duration volatility.
- Having multiple long corporate managers could inadvertently reduce the overall plan’s active share. A plan with several managers with the same guidelines and opportunity set may have offsetting overweights and underweights. This can have the effect of reducing the benefits of active management and result in an overall fixed income portfolio that closely resembles the benchmark. This is likely amplified in quality-constrained mandates. Expanding the investable universe to include securitized bonds allows for more security selection opportunities across managers.
Not a “One-Size-Fits-All” Approach
- Securitized bonds are not for every LDI solution. Plan sponsors and LDI partners should evaluate whether the diversification benefits of investing in securitized bonds outweigh the potentially higher asset-liability tracking error. Pensions seeking an out-of-benchmark allocation can do so in two ways:
- Tactical: Providing long-duration managers the flexibility to invest in long securitized sectors expands the investable toolkit to allow for more security selection opportunities. Maintaining a full credit or government/credit benchmark and allowing out-of-index ideas, such as securitized bonds, incentivizes managers to invest in the sector only when relative value is most attractive. Tactical utilization effectively transfers the securitized inclusion/exclusion decision to the fixed income manager.
- Strategic: A strategic allocation originates from the sponsor or consultant. Plans concerned with over-concentration in corporates or their exposure to specific corporate holdings may consider standalone allocations to securitized bonds. A broader securitized toolkit can be accessed by implementing an intermediate duration sleeve instead of long duration. This aligns well for pensions without as much duration need or those who use futures to adjust interest rate exposure.
Within the LDI space, long-duration CMOs are a useful tool either as an out-of-benchmark holding in a traditional LDI mandate or as a stand-alone allocation among a broader mix of portfolios. Long CMOs can improve the diversification of an LDI solution by reducing corporate allocations without sacrificing credit quality. However, we believe it is important to be mindful of reduced liquidity of the sector and likelihood of higher asset-liability tracking error. At IR+M, we have more than 30 years of experience partnering with our pension clients in crafting custom LDI solutions. We help clients navigate the unique risks and opportunities of the market to determine if long CMOs can help meet their plans’ objectives.