One of my favorite pastimes at IR+M is being pulled into what I have lovingly dubbed “Nerd Squad Musings.” One member of our Nerd Squad is a Bloomberg expert, and I’m pretty sure his creative process is: 1. Scour Bloomberg for fun; 2. Identify an interesting statistic; 3. Ask questions that inevitably pique our interest; and 4. Convince us to enthusiastically join his intellectual adventure. Last week, he asked if we could quantify the long corporate holdings of Defined Benefit (“DB”) pension plans and if so, how could additional de-risking affect the long corporate market? What followed was a typical (dare I say exciting?) journey where we recruited others to join our quest to uncover the story behind the numbers.
The year-to-date increase in funded status realized by many DB plans has prompted an asset allocation shift from equities into bonds.1 With a whopping $3.4 trillion in corporate DB assets, a small increase in the allocation to fixed income can drive a significant amount of demand. It is generally assumed that approximately 50% of DB plan assets are invested in fixed income, mostly long duration corporates. Let’s do some “actuary math”2 and say conservatively that pensions own as much as $1.2 trillion of long corporates (this doesn’t even account for insurance companies that continue to hedge terminated DB plans and hold substantial long corporate bond allocations). Having established the strong, growing demand from DB plans, we then sought to weave in long corporate supply dynamics, focusing on availability, investability, and liquidity.
The Bloomberg Long Corporate Index has a market value of $2.7 trillion. According to the SNL Financial data set, insurance companies own nearly $1 trillion of corporates, a portion of which may be higher yielding or non-index. Let’s use “actuary math” again and reasonably assume the Bloomberg Long Corporate Index holdings are in the $800 billion range. This $800 billion is typically unavailable for purchase because life insurance companies operate using a book yield investment approach.3 This effectively limits the available universe substantially, to something in the range of $1.9 trillion.
Next, we focused on what DB plans are most likely to buy in order to hedge their AA-based liabilities. Liability benchmarks are immune to downgrades, so if a bond drops out due to a rating change, the discount rate is simply re-calculated using the remaining bonds. Actively managed LDI portfolios, on the other hand, aim to avoid downgrades that can impact total return, potentially violate portfolio guidelines, and lead to an ill-timed adverse sale. It is difficult to get granular public data on pension fund holdings, but we believe DB investors tend to avoid Baa3/BBB- issues, which may be susceptible to downgrade. Baa3/BBB- rated issues total about $275 billion (about $66 billion of which are on watch for downgrade by at least one major rating agency), so the “buyable” universe shrinks even more, to around $1.6-1.7 trillion.
We rounded out our investigation with liquidity. We looked at the turnover of the Bloomberg Long Corporate Index (excluding Baa3/BBB-, preferreds, hybrids, and subordinated debt) and broke the issues into deciles:
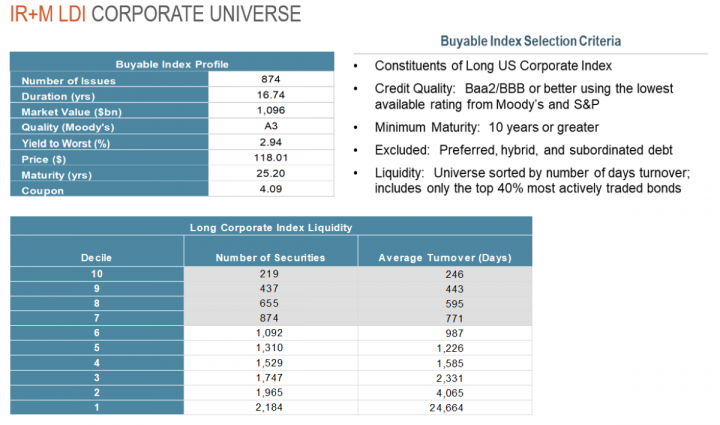
Yields are represented as of 8/31/21 and are subject to change. Shaded region in above table represents the portion of the Bloomberg Long Corporate Index in which we would likely invest based on IR+M’s selection criteria. Days turnover calculated by dividing the amount outstanding by the 30 day average TRACE volume. Securities with no TRACE data available were excluded. The views contained in this report are those of IR+M as of 8/31/21. The report is not intended to provide specific advice, recommendations for, or projected returns on any particular IR+M product. Source: Bloomberg and IR+M Analytics as of 8/31/21.
As evidenced by the illiquidity of the bottom 80%, these issues can easily require several years to turnover. Of course, an investor could pay-up to bring bonds out, but that can get expensive quickly. Pension plans and insurers already own about $1.2 trillion and $800 million, respectively, of the Bloomberg Long Corporate Index. This is more than the “buyable” universe, making us wonder – what price are pensions willing to pay to find long bonds for their increasing allocations?
Or are there other ways for pensions to find long bonds? The primary market has experienced significant new issue corporate supply over the past 18 months, almost $2.5 trillion total, of which about $775 billion was long paper. 4 While this amount is included in the index total above, new issue is certainly a good source of bonds. Second, portfolio trading has gained in popularity (driven by ETFs and algorithmic trading), providing increased liquidity.
Bringing everything together, of the estimated $1.6-1.7 trillion “buyable” Baa2/BBB or higher bonds in the Bloomberg Long Corporate Index, approximately one-third are relatively illiquid. A 10% move by pension plans into long corporate bonds would create roughly $340 billion of demand, or approximately 30% of the buyable, more liquid universe.5 This undoubtedly creates and sustains long term support for liquid, high-quality long corporates. We recognize that the demand may be offset by future supply and/or pension demand potentially shifting into the intermediate part of the curve.6 We will aim to further explore these topics in a future LDI-related blog, most likely inspired by another Nerd Squad Musing.