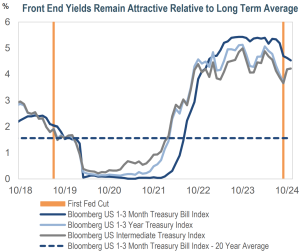
Source: Bloomberg as of 11/7/24 unless stated otherwise. Top chart: First Fed Cut refers to the date of the first cut in that respective cutting cycle. The 20-year average for the Bloomberg 1-3 Month Treasury Bill Index is from 10/31/04 to 10/31/24. The views contained in this report are those of Income Research + Management (“IR+M”) and are based on information obtained by IR+M from sources that are believed to be reliable, but IR+M makes no guarantee as to the accuracy or completeness of the underlying third-party data used to form IR+M’s views and opinions. As of: 10/31/24. Sources: Bloomberg and IR+M Analytics.
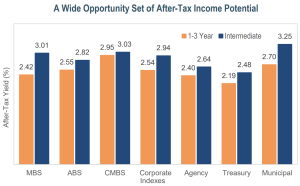
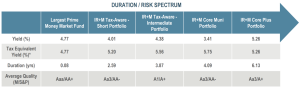
Top chart: each point is representative of the after-tax yield of the respective Bloomberg index as of 10/31/24. *Tax equivalent yield assumes a tax rate of 40.8%. The largest prime money market fund is based on a Bloomberg Fund Screen which compiles all funds that are: open-end funds, money markets, primary share class, and a geographic focus of United States. The prime money market fund uses a fund strategy of Taxable First Tier. The yield shown for money market funds is the 7-day SEC yield. Cash/other sector is cash, other non-negotiable time deposits, other repo agreements, and net other assets. Some statistics require assumptions for calculations which can be disclosed upon request. Yields are represented as of 10/31/24 and are subject to change.
The views contained in this report are those of Income Research + Management (“IR+M”) and are based on information obtained by IR+M from sources that are believed to be reliable but IR+M makes no guarantee as to the accuracy or completeness of the underlying third-party data used to form IR+M’s views and opinions. This report is for informational purposes only and is not intended to provide specific advice, recommendations, or projected returns for any particular IR+M product. Investing in securities involves risk of loss that clients should be prepared to bear. More specifically, investing in the bond market is subject to certain risks including but not limited to market, interest rate, credit, call or prepayment, extension, issuer, and inflation risk.
It should not be assumed that the yields or any other data presented exist today or will in the future. Past performance is not a guarantee of future results and current and future portfolio holdings are subject to risk. Securities listed in this presentation are for illustrative purposes only and are not a recommendation to purchase or sell any of the securities listed. Forward looking analyses are based on assumptions and may change. It should not be assumed that recommendations made in the future will be profitable or will equal the performance of the securities listed. Some statistics require assumptions for calculations which can be disclosed upon request.
Copyright © 2024, S&P Global Market Intelligence. Reproduction of any information, data or material, including ratings (“Content”) in any form is prohibited except with the prior written permission of the relevant party. Such party, its affiliates and suppliers (“Content Providers”) do not guarantee the accuracy, adequacy, completeness, timeliness or availability of any Content and are not responsible for any errors or omissions (negligent or otherwise), regardless of the cause, or for the results obtained from the use of such Content. In no event shall Content Providers be liable for any damages, costs, expenses, legal fees, or losses (including lost income or lost profit and opportunity costs) in connection with any use of the Content. A reference to a particular investment or security, a rating or any observation concerning an investment that is part of the Content is not a recommendation to buy, sell or hold such investment or security, does not address the suitability of an investment or security and should not be relied on as investment advice. Credit ratings are statements of opinions and are not statements of fact.
Source ICE Data Indices, LLC (“ICE Data”), is used with permission. ICE Data, its affiliates and their respective third party suppliers disclaim any and all warranties and representations, express and/or implied, including any warranties of merchantability or fitness for a particular purpose or use, including the indices, index data and any data included in, related to, or derived therefrom. Neither ICE Data, its affiliates nor their respective third party providers shall be subject to any damages or liability with respect to the adequacy, accuracy, timeliness or completeness of the indices or the index data or any component thereof, and the indices and index data and all components thereof are provided on an “as is” basis and your use is at your own risk. ICE Data, its affiliates and their respective third party suppliers do not sponsor, endorse, or recommend IR+M, or any of its products or services.
“Bloomberg®” and Bloomberg Indices are service marks of Bloomberg Finance L.P. and its affiliates, including Bloomberg Index Services Limited (“BISL”), the administrator of the index (collectively, “Bloomberg”) and have been licensed for use for certain purposes by IR+M. Bloomberg is not affiliated with IR+M, and Bloomberg does not approve, endorse, review, or recommend the products described herein. Bloomberg does not guarantee the timeliness, accurateness, or completeness of any data or information relating to any IR+M product.
IR+M claims compliance with the CFA Institute Asset Manager Code of Professional Conduct. This claim has not been verified by the CFA Institute.
This material may not be reproduced in any form or referred to in any other publication without express written permission from IR+M.
Fees:
The investment advisory fees charged by Income Research + Management are described in Part 2A of IR+M's Form ADV, which is available upon request. Actual returns will be reduced by advisory fees and any other expenses (custodial, etc.) that may be incurred in the management of an investment account. Investment management fees have an effect on the investment results achieved by a client. For instance, on a $100 million portfolio, an example IR+M fee might be 0.39%. A gross hypothetical return of 10.00% in a given year would be reduced to 9.61% if the client's annual investment management fee were 0.39%. Over a 5-year period of annual 10% returns, a gross return of 61.05% would be reduced to 58.82%
after the deduction of investment management fees. Different strategies may have different standard fees. Total returns including realized and unrealized gains plus interest and dividends are used to calculate investment performance. Cash is included in performance calculation. All returns are expressed in US$ terms. Trade date accounting and valuation are used. Past performance is not indicative of future results. Periods over one year are annualized. A similar analysis can be provided for any time period since inception.
Please see additional disclosures for important composite performance information such as inception date and historical index changes.
Please refer to your investment management agreement (“IMA”) for additional information including, but not limited to, investment advisory fee information.
Characteristics:
Unless otherwise noted, characteristics and holdings are from the representative portfolio of the applicable composite or specific to the client account included in this presentation. The representative portfolio information is supplemental to the IR+M Composite Disclosures. Some statistics require assumptions for calculations which can be disclosed upon request. Yields are represented as of the aforementioned dates and are subject to change. A similar analysis can be provided for any portfolio we manage. Totals may not sum due to rounding.
Sample Portfolios:
All sample portfolios are represented as of the aforementioned dates. There are limitations in sample results, including the fact that such results neither represent trading nor reflect the impact that economic market factors might have had on the management of the account if the adviser had been managing an actual client's money. Actual results may differ. A similar analysis can be provided of any portfolio we manage.