It used to be assumed that high-yield (HY) issuers were struggling companies, strapped for cash, highly levered, and on the brink of bankruptcy. Although this may be true for some issuers, the HY market also features many well-known companies that have larger capital structures and are on a path to deleveraging. Active management can help avoid the stereotypical “junk bonds” and uncover improving credit stories and/or future rising stars. In this piece, we examine the current state of the HY market, and where we see value in this environment.
Issuance: Keeping the Streak Alive
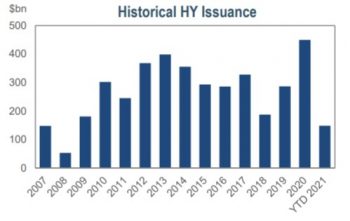
High-yield issuers flooded the primary market in 2020. Record-low yields incentivized companies to issue new bonds or refinance existing debt to build liquidity and shore up balance sheets. Last year’s $450 billion of supply was the heaviest annual total ever, eclipsing the previous all-time high by nearly $50 billion.
The deluge of supply has carried over to 2021. The prospects of higher rates and strong investor demand have persuaded issuers to bring planned issuance forward. Year-to-date supply has already surpassed $149 billion, with issuance in January, February, and March setting monthly records.
Heavy supply and a surge in fallen angels have contributed to the HY market growing substantially over the last two years. At the beginning of 2019, outstanding HY bonds totaled roughly $1.2 trillion. That total has grown to $1.5 trillion in March 2021, outpacing the growth rate for the investment-grade market. However, despite the recent surge, the HY market is still only one-fourth of the size of the investment-grade market.
Fallen Angels: Yesterday’s Trash, Today’s Treasure
Fallen angel volumes peaked in 2020. Last year, there was a record number of investment-grade corporates downgraded to HY – $185 billion – as many investment-grade issuers struggled due to the coronavirus. That pace has dramatically slowed this year, and more companies have been upgraded to investment-grade than downgraded to HY.
Outperformance by fallen angels has boosted high-yield returns. Historically, fallen angels outperform immediately after entering the Bloomberg Barclays High Yield Index (HY index), with most of the widening occurring prior to the downgrade. Fallen angels, however, have outperformed both BBB-rated and BB-rated issuers over the last twelve months, returning 30.8%, 5.2% and 10.8%, respectively.
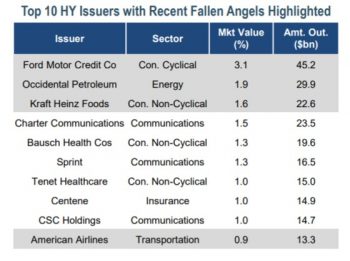
The surge in fallen angels has added new, larger issuers to the HY market. Companies such as Ford, Occidental Petroleum and Kraft-Heinz each have more than $22 billion of debt outstanding. Not only do these newly classified fallen angels have more debt, but the duration of their debt is typically longer. This attracts a wider range of investors, increasing liquidity. The average duration of fallen angel debt is 6.4 years, while bonds of non-fallen angel issuers average 3.4 years.
Fundamentals: Maybe Rising Tides Don’t Lift All Ships
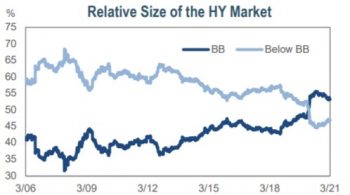
The HY market is the highest quality it has ever been. The size of the BB-rated portion of the HY index has grown to represent more than half of the HY universe. This was largely due to BB-rated issuers comprising most of supply, coupled with the large wave of fallen angels. BB-rated issuers were also able to take advantage of low rates and lock-in low funding costs, with the BB corporate yield falling below 3% for the first time ever.
Improving fundamentals and an economic recovery may result in more rising stars. Year-to-date, the number of issuers upgraded to investment-grade has outpaced those downgraded to high yield. This trend could continue as rating agencies reward issuers that benefit from a reopening of the economy. Over $39 billion of HY debt already trades at a spread less than that of BBB corporates, suggesting more rising stars are on the horizon.
But not all rating cohorts are improving. CCC-rated companies saw net leverage spike in the second quarter of 2020. Although leverage improved in the fourth quarter of 2020, it remains well above historical averages. Interest coverage ratios indicate that the majority of CCC issuers lack sufficient liquidity to cover interest rate payments. However, the trailing 12-month default rate for the overall HY market is still expected to fall below 3% by May, after a staggering $52 billion defaulted between April and July of 2020.
IR+M’s Take
In this environment, we remain cautious when adding incremental risk, and recommend staying up-in-quality within the HY universe. For investors with a higher risk tolerance, we see attractive upside potential for select BB-rated corporates relative to lower-quality high yield bonds.
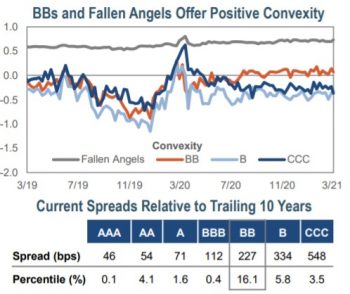
Limited price appreciation potential in Bs and CCCs. Roughly half of the HY index trades at a premium to the next call. This has increased the negative convexity, particularly in B and CCC-rated corporates, constraining any additional price appreciation if rates fall or spreads tighten. BBs have higher convexity due to the addition of fallen angels, which are mostly bullet bonds, and heavy issuance.
BBs relatively attractive. Spreads appear historically tight, however, less so for BBs. At 227bps, BB spreads are trading in the 16th percentile relative to the last 10 years – Bs and CCCs are trading in the 6th and 4th percentile.
Record supply and last year’s wave of fallen angels have made the HY market larger and higher quality. The larger capital structures of recent fallen angels have also increased liquidity and allowed a wider investor base to invest. While we are aware of potential risks throughout the high yield market, we believe that careful security selection can help investors avoid issuers with highly skewed, asymmetric risk profiles. Despite tight spreads, BBs, with the addition of numerous fallen angels, appear to offer the most attractive relative value.