The spread of the coronavirus has pushed countries around the world to implement immediate measures in an attempt to curb further contagion. As uncertainty has deepened, risk asset prices have plummeted, with year-to-date returns of both equities and investment-grade corporates negative. While the pace of these price declines may concern investors, this could be an opportunity to take advantage of historically cheap bonds, particularly in the long-end. In this piece, we discuss recent developments in the long corporate market, and how we believe recent underperformance has created an attractive entry point for long-term investors.
MarchING HIGHER
This month’s dramatic sell-off has led to numerous dislocations in investment-grade markets. After long corporate yields reached record all-time lows earlier this year, they have swiftly changed course in March.
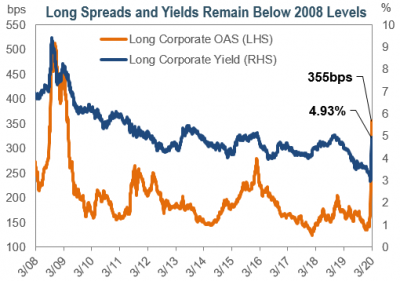
As of March 20th, long corporate yields are up to 4.93% – the highest level since 2018. Overseas and LDI investors typically enter the market when long yields approach 5%, as hedging costs and yield targets become more attractive. Interest from foreign investors has risen recently as yields increased, particularly for high-quality, on-the-run long corporate bonds. After accounting for hedging costs, yields have reached over 3% for Taiwanese buyers of 30-year Treasuries and over 2% for Japanese investors of 10-year Treasuries.
Year-to-date, long corporate spreads have widened by over 200bps, from 136bps to 355bps. However, the majority of the move has taken place in the last 30 days, accounting for almost 160bps of the spread widening. Although spreads have surpassed the 2016 wides reached during the energy crisis, they remain well below the levels seen during the Great Financial Crisis. Additionally, since 2000, long corporate spreads have been tighter than this level nearly 95% of the time.
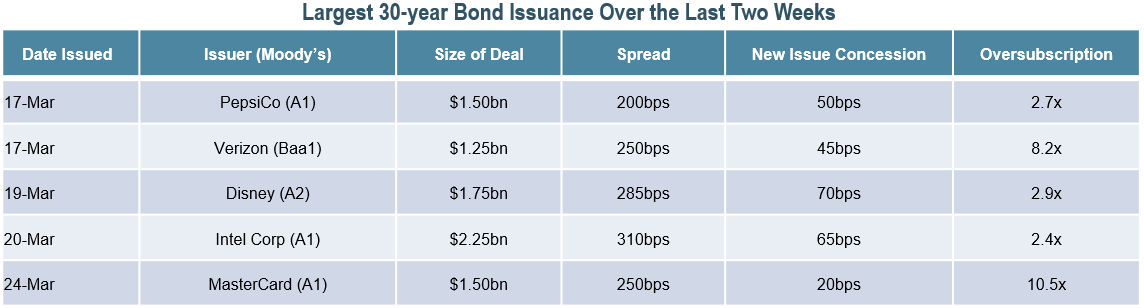
Issuance has totaled almost $100 billion over the last two weeks, concentrated in higher-quality, long-duration bonds. On average, issuers have paid new issue concessions of 35-75bps, up from 1.2bps prior to March. These new issue concessions have pressured secondary spreads, as investors have re-priced existing issues in sympathy with concessions. Over the last two weeks, there has not been any issuance of corporates with maturities of less than 5-years, as issuers have avoided the lack of liquidity in the front-end.
INVESTORS HAVE THE OPPORTUNITY TO BUY HIGH-QUALITY ISSUERS AT DISCOUNTS
Given the recent correction in risk assets, investors may be considering re-risking their pension plans by re-allocating to growth assets and reducing hedging assets. Corporate pension plans have faced significant headwinds since year-end, as equity prices have fallen over 24% and interest rates have declined. Average funded status ratios have dropped by 5-10% year-to-date.
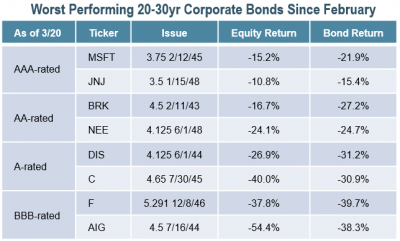
However, the fixed income market also offers an opportunity for investors to purchase investment-grade issuers that have underperformed in tandem with their equity counterparts. Year-to-date, the Bloomberg Barclays Long Corporate Index has returned -29.2%. This could enable plans to alternatively consider re-risking within their hedging portfolios.
Liquidity in the long-end is relatively stable compared to other segments of the market. As buyers in a market of sellers, investors may capitalize on attractive spreads, and in the case of fixed income, at a higher part of the capital structure relative to equities.
IT’S NOT ABOUT WHERE YOU END UP, BUT HOW YOU GOT THERE
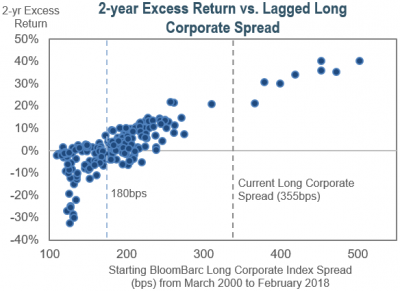 Long corporate spreads in excess of 250bps may signal an attractive entry point for long-term investors. Historically, a starting spread of 180bps or greater has – on average – resulted in a positive 2-year excess return. Conversely, long corporate spreads below 180bps typically resulted in a negative excess return.
During the Great Financial Crisis, long corporate spreads increased to 512bps, which was significantly wider than current spreads of 355bps. However, spreads then tightened more than 300bps over a 10-month period, from December 2008 to October 2009. Investors who can withstand potential volatility may benefit from longer-term return potential.
Recent underperformance across risk assets has pushed long corporate spreads to historical wides. We believe this could be a well-timed entry point for long-term investors. At IR+M, we feel we are opportunistically participating in the new issue and secondary market, and sourcing undervalued long-duration corporates at favorable levels. The uncertainty surrounding the coronavirus could continue for the foreseeable future. However, we will rely on our experience as bottom-up security selectors to find attractively priced bonds that may weather this volatility.