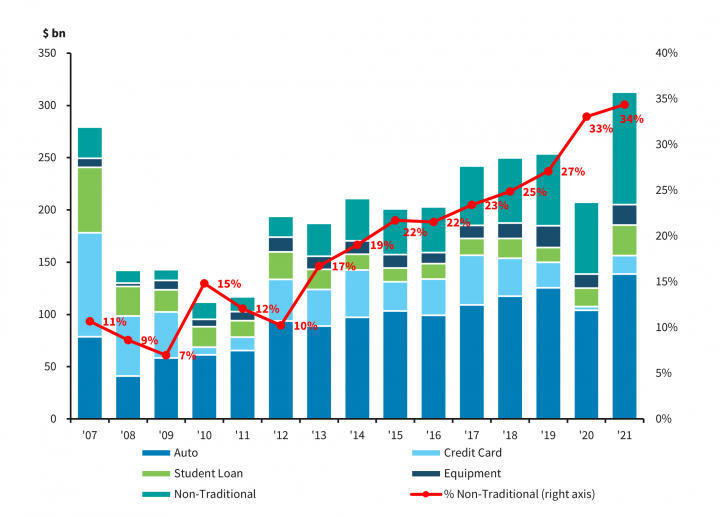
The market for asset-backed securities (ABS) has grown substantially over the years, especially since I started analyzing them over 10 years ago. What was once primarily a market consisting of credit card, auto, and student loan collateral has expanded into many other collateral types. While some of these newer securitizations might have been considered “esoteric” in the past, they are quickly becoming mainstream. Issuance of ABS deals backed by “non-traditional” assets – such as franchise royalties, single-family rentals, data centers, and aircraft and railcar leases – continues to grow. These sectors once accounted for less than 15% of annual ABS issuance from 2007 to 2009, but have since grown to a $90+ billion sector composing roughly one-third of new ABS supply. Perhaps a sign of the changing times, vanilla credit card ABS now accounts for less than 10% of annual issuance.
As investors have increased allocations to these “non-traditional” sectors in search of yield, scrutiny has started to mount regarding the ratings of the bonds. Of the $90+ billion of non-traditional ABS issued in 2021, the vast majority had only one public rating from a ‘Big 3’ ratings firm (Moody’s, S&P, or Fitch) or lacked a ‘Big 3’ rating altogether. This contrasts sharply to the investment-grade corporate bond market, where at least two public ratings from a ‘Big 3’ agency are standard.
Chart 1: Historical ABS Issuance
This discrepancy in ratings came into focus in December, when the Wall Street Journal (WSJ) reported that regulators for the insurance industry would require increased disclosures for private debt (including ABS) after a study found that ratings for the same security can differ by as much as five notches between firms. This news followed an announcement from S&P that they were proposing a revised capital model for insurers that would result in increased capital charges for bonds that lack a S&P rating as well as those that lack a rating from a ‘Big 3’ firm. The proposed capital treatment for bonds that do not have a ‘Big 3’ rating is particularly harsh, as the ratings input automatically defaults to the lowest possible mapping of ‘CCC’. S&P recently extended the comment period for its proposed capital model to March 18th, although Barclays believes the agency will try to finalize its new methodology by mid-2022. Significant pushback is expected, and while we agree that liquidity may be weaker for deals lacking a ‘Big 3’ rating, they should be analyzed based on their collateral quality, cash flow stability, and investor protections via deal triggers, not solely based on ratings.
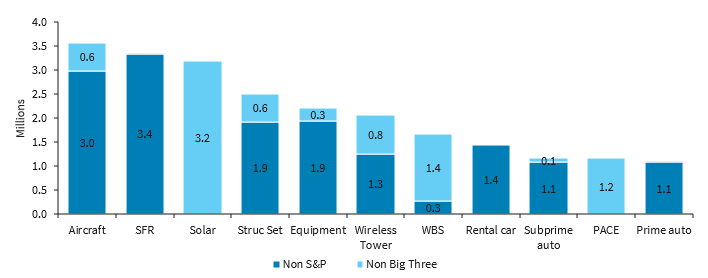
Given the increased focus on non-traditional ABS and particularly those that lack a ‘Big 3’ rating, it seems appropriate to ask: which sub-sectors are most impacted by the new capital model, and how much of these securities do insurance entities hold? According to Barclays research, insurance entities hold over $8 billion of ABS that do not have a ‘Big 3 rating’, with the largest exposures including solar ABS ($3.2 billion), Whole Business Securitizations (WBS) ($1.4 billion), and Property Assessed Clean Energy financing (PACE) ($1.2 billion). These sectors offer relatively longer durations and higher yields, making them ideal candidates for life insurance accounts that typically hold bonds to maturity. Other sectors impacted by the proposed capital model are non-agency Commercial Mortgage-Backed Securities (CMBS) and Collateralized Loan Obligations (CLOs), with subordinate tranches facing the largest increase in capital charges.
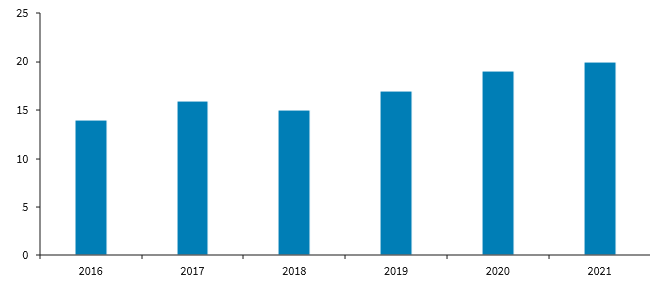
Chart 2: Insurance Ownership of the ABS Market Over Time (%)
Although $8 billion seems like a manageable amount of affected debt, the impact of the new capital rules within specific sub-sectors of non-traditional ABS could be pronounced. Barclay’s research indicates that non-Big 3-rated debt held by insurance companies accounts for between 43 and 48% of both the Solar and PACE ABS markets, making them particularly vulnerable to the proposed capital changes. Although holdings of non-restaurant WBS are not disclosed, we suspect that insurance participation in this sector is significant, as well.
Chart 3: Insurance Holdings of Non-Traditional ABS (Non-S&P and Non-Big 3 Agency)
Perhaps the bigger question facing the non-traditional ABS market relates to the knock-on effects of reducing/eliminating insurance demand for particular products. Non-traditional ABS are generally less liquid than investment-grade corporate bonds, and liquidity-sensitive accounts such as money managers and hedge funds may demand higher spread concessions at new issue to fill the void left by insurance accounts. These higher financing costs may make securitization a less attractive financing source for issuers, especially for those that do not rely as heavily on ABS financing.
The market may ultimately adapt to these changes through greater usage of bond “wrappers”, although these guarantees have become less common since the financial crisis. Bond wrappers – which effectively enable an upgrade to the guarantor’s rating – are available for only a limited number of sub-sectors and may be prohibitively expensive for the bond buyer.
At IR&M, ratings are just one of many factors that play a role in the investment process. Performance history, seniority of repayment, liquidity, and alignment of incentives with the securitization sponsor all play a vital role. For all the scrutiny that is currently being directed at deals that do not have a rating from a ‘Big 3’ rating agency, it is worth noting that Aircraft ABS – which is rated by all of the ‘Big 3’ firms – has one of the worst performance track records of any ABS sub-sector. Therefore, applying a broad rule that eliminates certain rating agencies from the investment decision-making process is misguided and lacking nuance. We believe proprietary research, trading, and active portfolio management are typically needed for investors to benefit from the extra yield that non-traditional ABS offers.