Every spring, Income Research + Management (IR+M) delves into insurance company filings and extracts the previous year’s key investment portfolio trends. In 2023, the overarching theme was reminiscent of that in 2022. Similar to 2022, insurers continued to benefit from higher new money yields, but unlike 2022, had the added benefit of strong equity returns in 2023, with net investment income reaching a new pinnacle. Today, with elevated yields, we believe that insurers can further optimize their investment portfolios.
2023 Allocation Lookback
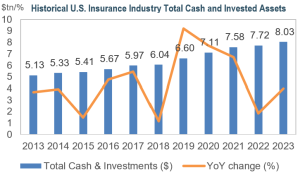
- Insurers benefited from a combination of favorable equity market returns and higher new money yields. In 2023, U.S. insurers’ total cash & investments grew by $309 billion to over $8 trillion, a 4% increase year-over-year (YoY).
- Insurers’ net investment income set a record for the second consecutive year. For life insurers, net investment income increased a record-setting 9.6% YoY, achieving a new high of $225 billion.
- After a weak 2022, insurers reported an improvement in their unrealized gain/loss position of $82 billion in 2023 and realized gains of $38 billion.
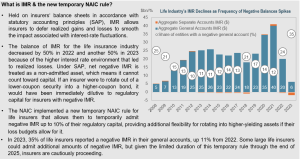
- Life insurers’ total realized capital losses reached a 15-year high of almost $39 billion. In 2023, insurers actively sold their securities with lower book yields and reinvested the proceeds at higher rates, resulting in a nearly $7 billion increase in capital losses, albeit with enhanced book yield. The impact of those realized losses was understated due to life insurers’ ability to defer certain realized gains and losses to their interest maintenance reserve (IMR).

- Asset allocation changes were modest. Insurers’ allocations to bonds marginally decreased and equity allocations slightly rose due to significant equity in-market strength.
- Insurers’ allocations to cash/short-term investments increased as insurers reinvested proceeds from maturing holdings into shorter-duration, higher-yielding bonds.

Fixed Income Observations
- Allocations to fixed income were relatively stable YoY. While still remaining the largest asset class at 60.8%, allocations decreased 1.5% YoY, and roughly 9.2% since 2010, as insurers have sought higher yields in other alternative asset classes amidst a prolonged low interest rate environment.
- In 2023, overall credit quality based on the temporary National Association of Insurance Commissioners (NAIC) designations continued to improve as the yield advantage between investment grade and high yield bonds remained well below historical averages. Investment grade bonds (those with NAIC 1 and 2 designations) accounted for 95% of bonds, up a marginal 0.3% since 2022. Below investment grade bonds (those with NAIC 3 designations and below) decreased to 5% of total bond exposure, after reaching 6.1% in 2020.
Fixed Income Observations Spotlight: NAIC's Principles-Based Bond Definition Project's Impact on Asset-Backed Securities
- In 2023, the NAIC voted to update the accounting treatment rules for a new “principles-based” definition of a bond, which will become effective on January 1, 2025. Insurance regulators want to ensure that structured securities provide the stable and predictable cash flows typically characterized by debt.
- The current NAIC definition of a bond is quite broad, whereas the new rule requires that a bond be either 1) an issuer credit obligation or 2) an asset-backed security (ABS).
- This new definition may cause investments to be reclassified between investment schedules, which could impact asset valuation reserves’, Risk-Based Capital (RBC) charges, and ultimately the broader ABS market.
- The new definition for ABS stipulates that:
- The holder of a debt security issued by an ABS issuer must be in a different economic position than if the holder owned the ABS issuers’ assets directly (“Substantive Credit Enhancement”). This is most likely the case for investment-grade tranches.
- ABS backed by cash generating non-financial assets must meet a “Meaningful Level of Cash Flows” test. In analyzing whether a security passes the test, investors must consider both the contractual cash flows in place, as well as the price volatility of the underlying asset (among other factors). As a practical expedient to passing the test, securities that repay more than 50% of the bond balance through contractual amortization of the debt are considered to have a ‘meaningful’ level of cash flows.
- The NAIC is also changing RBC charge requirements for all ABS residuals – the RBC charge on residual tranches is increasing from 30% to 45% for life insurers and may also increase to 45% for health and P&C insurers.
- Given that ABS and other structured securities have been the fastest growing bond types in recent years, this new definition may change how insurers invest going forward, as well as the pace of new investment within the sector. We believe these changes further underscore the importance of fundamental credit research and a solid understanding of both the underlying collateral and structure.
IR+M's Take on 2024 & Opportunities in the Current Market Environment
- Amid continuing rate volatility and uncertainty regarding the timing of the Federal Reserve’s first rate cut, we believe we can partner with insurers to further optimize their investment portfolios.
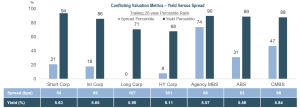
- Over the last year, we have seen significant spread compression, with corporate spreads near or close to record tights. Although spreads remain narrow across sectors, the overall yield environment remains high, and opportunities persist, particularly within:
- Asset-Backed Securities (ABS) (Non-traditional): We favor high quality non-traditional ABS subsectors from programmatic issuers. We believe these subsectors offer insurers attractive spreads, yields, and capital treatment. These sectors also provide diversification, stable cashflows, and strong structural protections.
- Commercial Mortgage-Backed Securities (CMBS): Given market concerns around commercial real estate (CRE), we believe CMBS spreads offer a meaningfully attractive entry point; however, security selection and credit analysis must be heavily emphasized. New issue deals and seasoned securities backed by low office exposure, diversified property types, favorable geographic footprints, and high levels of structural credit enhancement offer attractive risk/reward characteristics. As investors within the AAA-tranche, our primary concern is around extension risk, rather than principal loss, due to the strength of the structure and significant credit enhancement that can build as a deal seasons and de-levers. Understanding potential extension risk is top of mind and a key part of our valuation framework when assessing potential investment opportunities within this sector.
- Small Business Administration Loans (SBAs): At IR+M, we invest in pools backed by loans issued under the SBA’s 504 Loan Program. Guaranteed by the full faith and credit of the US Treasury, we believe SBAs offer insurers diversification benefits with attractive spreads, yields, capital treatment.
With elevated yields and uncertainty around rate cuts, we believe that robust, bottom-up security selection is more essential than ever. Through our experience of managing high-quality, fixed income portfolios, we feel we are well-positioned to partner with our insurance clients in optimizing their book yield and limiting financial statement volatility.