
Just as the blooms emerge on the flowers and trees each spring, so do insurance companies’ annual filings. Each year, we at IR+M delve into these documents and illuminate how insurers’ investment portfolios evolved over the previous year. In 2024, insurers were positioned more defensively as they increased portfolio liquidity and realized record results due to elevated yields and positive equity returns. As insurers continue to navigate persistent and pervasive uncertainty, flexibility will remain essential.
Review of 2024
- Insurer assets and net investment income (NII) reached record highs in 2024. Thanks to a supportive equity market and higher new money yields, the total book value of cash and invested assets grew by $433 billion to nearly $8.5 trillion, a 5.4% increase year-over-year (YoY). Higher interest rates supported total NII, which increased by 14.0% to $350 billion, exceeding the previous year’s record for a third consecutive year.
- Net investment income reached new 25-year highs across P&C, Health, and Life in 2024. P&C NII, in particular, accelerated at the fastest pace, increasing by 29.3% YoY.
- Realized gains supported by P&C sales. Insurers closed the year with $74 billion in realized gains, a record for the industry and an increase of $40 billion from 2023. P&C insurers realized $80 billion in gains, which was likely due to sales of equity exposure. During 2024, the total insurance industry unrealized capital position fell by $14 billion.
- Insurers continued to search for incremental yield. The elevated interest rate environment helped improve net yield to 4.2% through higher book yields for bond portfolios and allocations to equities and other³ assets.

Asset Allocation Lookback
- Equity exposure dropped as insurers locked in gains. The S&P 500 Index was up over 24% in 2024, and insurers opportunistically monetized outperformance – decreasing equity allocations by over 1% to 7.4%.
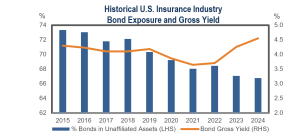
- Fixed income down but not out. Despite enticing yields, the U.S. insurance industry marginally decreased bond allocations by 0.3% to 66.8%. The dip was driven by Life insurer allocation changes, whereas P&C and Health insurers increased exposures by 0.6% and 1.2%, respectively. The sector’s gross yield of 4.5% was attractive relative to recent history; however, overall spreads remained at tight levels.
- Private allocations continued to grow but decelerated. The sector’s allocation grew precipitously between 2019 and 2022, when assets averaged a 13.6% increase per year. The gross yield on Long-Term Investments has since declined, falling 2.75% to 6.29%, as has the annualized growth rate. The sector’s weight grew slightly YoY to 6.8%.
- Within Schedule BA, Private Equity remained favored. In 2024, private equity was again the preferred vehicle among Schedule BA assets for US insurers. Although private equity exposure has dipped since its 2021 peak of over 50% of Long-Term Investments, 2024’s 49% was in-line with the 10-year average of 48.8%.
¹Table includes the total insurance industry (Life, Health, and P&C insurers). ²Unrealized Capital Gains/(Losses) Change shows the change in net unrealized capital gains less capital gains tax and includes equity in undistributed income.³Other includes Real Estate and Other Investments.
Notable Bond Portfolio Trends
- Cash and short-term investments spiked due to attractive short-term rates and desire for liquidity. Exposures to cash and short-term investments rose to 7.5% from 6.5% as an inverted and flat yield curve boosted the appeal of short assets. For P&C insurers’, the allocation was the fastest-growing segment of their balance sheets and increased by 3.5% YoY due to a preference for liquidity during a year of elevated catastrophe losses.
- Insurers maintained an up-in-quality approach. Insurance portfolios’ asset quality increased slightly as the exposures to bonds rated NAIC 3 through 6, which denote below investment-grade ratings, dropped by 0.2% to 4.6% of insurer portfolios, the lowest since 2008. Insurers of all types moved up in quality for a third consecutive year.
- Securitized bonds were still preferable to corporates. Securitized exposure grew by approximately 1% in each of the last 2 years and ended 2024 at 25.2% of bond holdings. The increase stemmed from a rise in residential mortgage-backed security (RMBS) and structured securities assets. Alternatively, issuer obligations, steadily decreased and registered a new 10-year low of 72%.
- Private Placements exposure continued to rise. In 2024, US insurers’ private placement holdings were a record-setting 37.3% of total bonds, with Life insurers allocating 45.5% of bond holdings to the sector. Conversely, P&C and Health channels’ private placement exposure has slowly declined since peaking in the early 2020s.


¹Health data as provided by S&P SNL does not sum to 100% due to different filing methods. ²Other includes Real Estate and Other Investments.
IR+M’s Take On 2025
- Uncertainty has been pervasive in 2025. The Federal Reserve’s (Fed) dual mandate of managing inflation and maintaining growth in the economy has only become more difficult with the introduction of increased tariffs and softening consumer sentiment.
- Issuer fundamentals remain healthy, but could deteriorate if the economy is further pressured, underscoring the importance of security selection.
- At IR+M, we partner with insurers to weather these headwinds and optimize their investment portfolios in this environment. While spreads overall are not overly compelling, it is important not to paint the fixed income market with a broad brush. We continue to find opportunities within the following parts of the market:
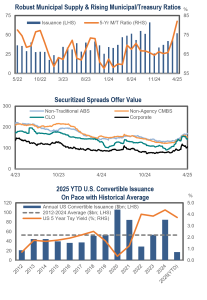
- Municipals: Due to record-setting supply and policy uncertainty, tax-exempt valuations appear attractive relative to recent history. We view current muni/Treasury ratios as a compelling entry point for insurers looking to improve after-tax yield in a high-quality alternative to investment-grade corporates.
- Securitized: We believe the securitized market continues to offer attractive relative value versus other spread sectors, particularly on a risk-adjusted basis. The heterogenous risk profiles and collateral types allow insurers to emphasize high-quality income and improve diversification, especially those in:
- CMBS: AAA-rated seasoned conduit deals, with limited office exposure, and select single-asset-single-borrower (SASB) securities can offer comparable spreads to investment-grade corporates.
- CLOs: managers with long-term, proven track records through multiple market cycles appear attractive versus lower-rated front-end alternatives.
- Non-traditional ABS: a growing and evolving part of the ABS market, with subsectors such as Whole Business Securitizations, can provide a yield pick-up versus traditional ABS and similarly-rated corporates.
- Investment-Grade Convertibles: Convertible supply has recently made a comeback due to the higher rate environment. Companies can issue bonds in the convertible market with lower coupons relative to the corporate market. As a result, there are increasingly more opportunities to invest in high-quality issuers in a unique structure with favorable capital treatment.
As uncertainty and elevated volatility permeate the market, we believe a focus on bottom-up security selection is vital. As a high-quality, fixed income manager, we believe that partnering with our insurance clients to optimize their book yield profile, while limiting financial statement volatility, is paramount.
Top Chart Sources: Bloomberg as of 04/30/25. Middle Chart: Source: Bloomberg as of 4/30/25 Shows the option-adjusted spread (OAS) for the respective Bloomberg indices unless otherwise noted. CLO spreads are sourced from the JP Morgan CLOIE Index AAA Discount Margin. Non-Traditional ABS spreads sourced from the ICE BofA US Fixed Rate Miscellaneous ABS Index. Bottom Chart Sources: BofA Global Research as of 4/30/25. Reprinted by permission. Copyright © 2025 Bank of America Corporation (“BAC”). The use of the above in no way implies that BAC or any of its affiliates endorses the views or interpretation or the use of such information or acts as any endorsement of the use of such information. The information is provided "as is" and none of BAC or any of its affiliates warrants the accuracy or completeness of the information.