With the recent market dislocation, yields on high-yield (HY) corporate debt have moved to about 8.5%, more than double what they were at year end and about 240bps above their 10-year average. Including now, we’ve seen only five periods of yields over 7% since the Global Financial Crisis (GFC); two lasted about a year while two were over in a matter of weeks. Current spreads near 500bps are about 70bps above their 10-year average and over 100bps wide to their 5-year average. How often are spreads wider than they are currently? Post-GFC, spreads were wider only in 2011, 2016, 2018, and during the pandemic, remaining there from a few months to about a year. According to J.P. Morgan (JPM) research, 1-year forward returns have averaged 13.05% when the initial yield was over 8%.
Chart 1: Bloomberg US Corporate High Yield Index Historical Yields & Spreads
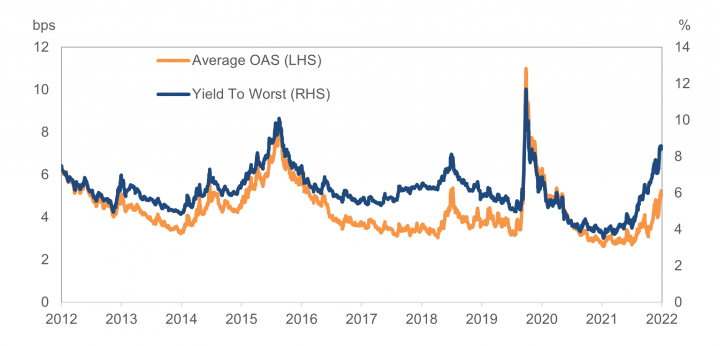
Markets have begun to price-in persistent inflation and ultimately a good chance of recession, with an increasing narrative expecting a recession in 2023. Given the uncertainty of the timing and depth of economic weakness, spreads could go wider, liquidity could weaken, and defaults will likely rise from the current low levels. Experience tells us that dislocations typically last for much shorter periods than recoveries (and over the long run, markets exhibit longer periods of stability) and the opportunities to capitalize on dislocations tend to be short lived. Of course, one could argue that this time is different. The Federal Reserve (Fed) is behind the curve, there is war in Ukraine, supply chain pressures are sticky, energy costs are at a 14-year high, and Covid lingers.
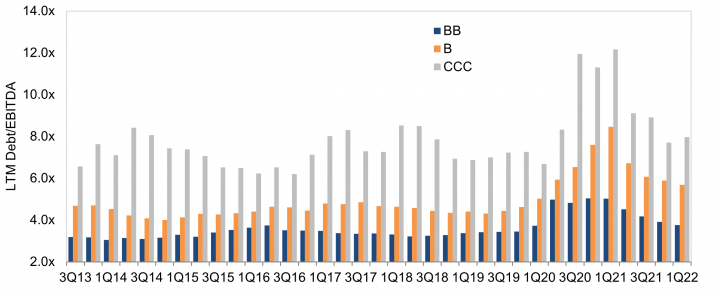
On the other hand, fundamentals are in a relatively strong position. Thanks due largely to fallen angels, average quality is close to the highest it has ever been, and average dollar prices in the high $80s (higher interest rates = lower dollar prices) provide positive credit convexity. More of the aggressive LBO-type new issue supply has moved over to the loan market, given strong investor demand for floating rate paper. Margins are solid, although starting to see some pressures from inflation, and while the potential for rates to move even higher may drive concerns about maturity walls (i.e. companies’ abilities to refinance near-term maturities), they are actually in good shape due to HY issuers taking advantage of cheap rates over the past couple of years; similarly, interest coverage is at record highs. The current 4.57x gross leverage of the HY market has declined for the fourth quarter in a row and is at the lower end of the 25-year range, and net leverage is 3.94x given recent years’ access to capital. It’s also interesting to note how leverage trends vary across ratings buckets, as shown in the chart below.
Chart 2: Historical Leverage by Rating
What is an investor buying within the HY universe? Looking at the Bloomberg US Corporate High Yield Index, the market value is almost $1.3 trillion, with about 2,000 issues across 950 issuers. Once a smaller asset class, the HY market now finances many household names such as Ford and Charter, which are the two largest issuers in the Index, as well as names that may be overlooked given their unique subsector or smaller size but have leading market share. The HY market has a duration of 4.3 years with an average coupon of 5.7% and average dollar price of $87. With more than half the market BB-rated, the average quality of the market is Ba3/B1. When compared with the US investment grade (IG) corporate market, HY has a much higher concentration in the consumer cyclical, communications, and energy sectors, and a much smaller weighting in banking (roughly 1%).
Table 1: Investment Grade vs. High Yield Sector Weightings

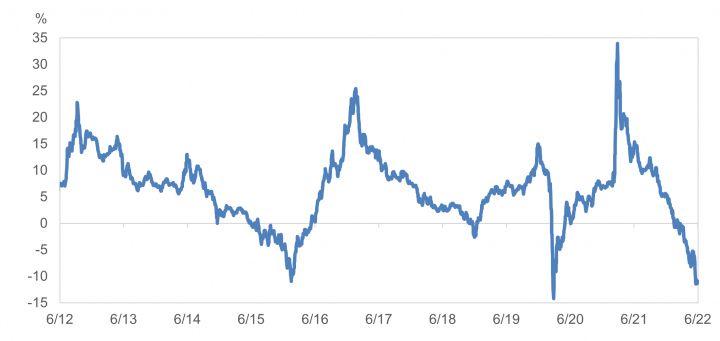
What is the case for HY right now? We believe it is threefold: 1) the higher yield acts as a cushion against rising rates, 2) diversification, and 3) current prices are an attractive entry point. With an 8.5% yield, the higher income is like having the wind at your back, a tailwind that dampens bond price depreciation and a propeller for performance over time. Besides yield, HY provides portfolio diversification. Over the past 20 years, the correlation of monthly returns of the HY and IG Indices is 0.24, and for HY and Treasuries, it is -0.17. Over time, 12-month rolling total returns for the HY Index are predominately positive. Drawdowns that do occur are relatively infrequent and short-lived. There have been four periods over the past 10 years when the rolling 12-month return spent time below zero; the duration of these negative returns was as follows: June 2015 – June 2016 (energy recession), Dec 2018 – Jan 2019 (Fed hike and growth concerns), March 2020 – May 2020 (pandemic), and currently we are 4+ months into negative territory. The cumulative total return over the past 10 years has been over 60%, about 4.8% annually, and that is with us currently sitting at an adverse endpoint.
Chart 3: Bloomberg US Corporate High Yield Index Rolling 12-Month Total Return
While defaults are now running below 2%, according to Moody’s, they are expected to rise to 3.3% by May 2023 (vs. 4.1% long-term average), making a focus on strong bottom-up credit research paramount. Viewed holistically and historically, the HY universe is healthy, and is in a good position to weather a mild, broad-based recession. Inflation and Fed policy remain the major watchouts.
Although there are signs that it could get worse before it gets better, yields are starting to look attractive. Without trying to time the market exactly, it may be worth averaging-in as the Fed’s quantitative tightening (QT) takes hold and HY spreads decompress. A prudent diverse portfolio with a Ba3 rating can currently be put together that yields close to 7.5%, with a duration around four years. Our credit analysts are working hard to ensure that portfolio holdings can weather a storm. Volatility is elevated and dispersion is picking up, making it the ultimate credit picker’s market. The HY manager universe is also diverse – from high-quality HY to distressed/workout products, so it is important for investors to understand their risk tolerance and investment objectives when selecting a manager. Drawdowns are inevitable, but value can be added with tactical allocations, strong security selection, evaluating and understanding manager style, and specific portfolio positioning.