
Traditionally, Liability Driven Investing (LDI) solutions have focused on long duration products. However, today’s Long Credit spreads remain tight to historical averages, and investors are seemingly not being compensated for taking on duration risk with the inverted yield curve. As an alternative, Intermediate Credit may offer an attractive entry point at current spread levels, and the positive carry can further reinforce funded statuses.
In this piece, we explore how plan type and objectives may influence the addition of Intermediate Credit in LDI solutions. We evaluated the addition of Intermediate Credit to our Average, Mature, and Young plans, and we employed both back-testing and forward-looking Monte Carlo simulations to highlight sponsor considerations.
We found that:
- Adding an Intermediate Credit allocation did not improve our Young Plan’s results;
- Our Average Plan’s risk and return may be improved with a tactical allocation to Intermediate Credit; and
- Our Mature Plan may benefit from a strategic allocation to Intermediate Credit.
Total Return Perspective
The credit curve is flat. The spread basis between Long Credit and Intermediate Credit has narrowed over the past decade, and currently sits at 13bps. The 10-year Treasury rate is only 17bps less than the 30-year Treasury rate, and the flat and inverted Treasury yield curve has resulted in similar carry across the curve. We define carry as the sum of the yield-to-worst, convexity benefit, and roll-down.
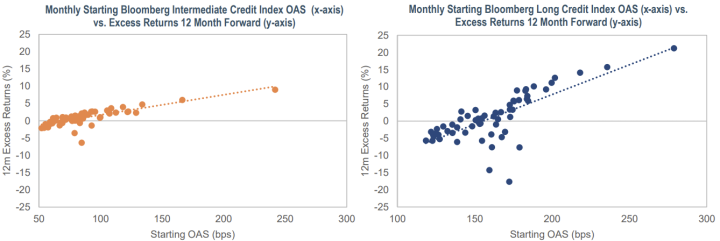
Current Intermediate Credit spread levels offer an attractive entry point. Historically, starting spreads of 200bps and 110bps or greater for Long Credit and Intermediate Credit, respectively, have – on average – resulted in a positive 12-month forward excess return. Conversely, spreads below those levels have typically resulted in a negative excess return. With current Intermediate Credit spreads at 114bps versus Long Credit spreads at 138bps, Intermediate Credit is providing more spread per unit of spread duration. Further, as visualized from the graphs, Intermediate Credit provides stronger downside protection and less dispersion in forward excess returns.
Strong Long technicals are expected to endure in the near term. Market consensus is that long supply will remain depressed. In the last couple of years, many issuers came to market at much lower financing costs, and the lack of mergers and acquisitions remain a headwind. Recent deals have narrowed the coupon basis across maturity tranches, and issuers now prefer to issue in the short end compared to the long end. Meanwhile, there is persistent long-end demand from captive buyers including corporate pensions, insurance, and foreign investors.
Under An LDI Framework
Corporate pensions’ fixed income duration needs have been trending down. With most plans soft or hard frozen, liability durations have and will continue to naturally decrease as plans age. Recent higher funded statuses and allocations to fixed income have also resulted in reduced duration requirements to maintain target hedge ratios. Adding Intermediate Credit can help meet hedge ratios (HR) while also providing broader curve exposure and thus improving the hedge with liabilities.
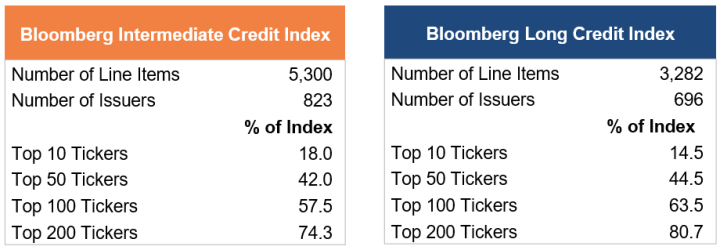
Tapping a more expansive universe. Intermediate Credit has more diversification amongst names and sectors than Long Credit. The ability to invest in out-of-index ideas is also enhanced via increased issuance of high quality securitized and high yield fixed income within the maturity spectrum. Specifically, incorporating high yield can further improve on the carry potential mentioned above while reducing equity exposure and thus funded status risk.
Intermediate Credit’s carry advantage may mitigate the overall impact to funded status volatility. Given current market dynamics, plans may look to source an Intermediate Credit allocation from Long Credit. Given the liability aging described above, plans may also benefit from funding an Intermediate Credit allocation from return-seeking assets, leading to lower asset-liability risk.
Putting Our Theory to the Test
We recognize that no two plans are the same, and we evaluated the addition of Intermediate Credit against our Average, Mature, and Young plans to highlight the various considerations facing plan sponsors. We employed both back-testing and forward-looking Monte Carlo simulations in our analysis, and we summarize the high-level takeaways below.
Our analysis focused on comparing the additional carry advantage from Intermediate Credit to the potential increase in funded status volatility. We made a couple of assumptions in our case studies. First, we assumed a 100% allocation to fixed income, comprised only of Intermediate Credit, Long Credit, Intermediate Treasury, and Long Treasury. We recognize most plans have allocations to growth assets, but this assumption facilitates side by side comparison of results across plans. Higher allocations to return-seeking assets may suggest greater duration needs to maintain hedge ratios, which may reduce optimal allocations to Intermediate Credit. Second, we evaluated a change from a 100% to a 90% hedge ratio. Of course, overlaying a completion strategy in practice can maintain original hedge ratio and key rate duration targets, limiting asset-liability risk.
Young Plan
Investing in Intermediate Credit was not advantageous in our Young Plan. Our Young Plan has a liability duration of 13.0 years; this compares to duration of 12.0 years for Long Credit and 3.9 years for Intermediate Credit. Given the long duration needs, only minor allocations could be made to Intermediate Credit to maintain a 90% or 100% hedge ratio. These allocations were immaterial in improving carry or mitigating asset-liability risk.
Average Plan
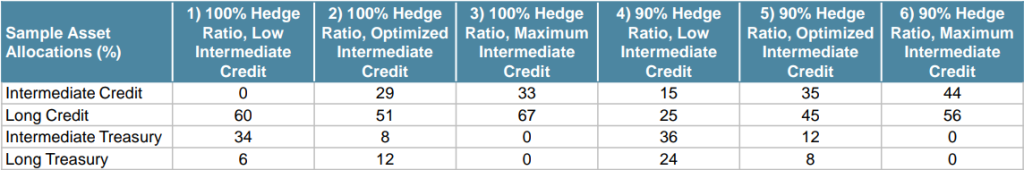
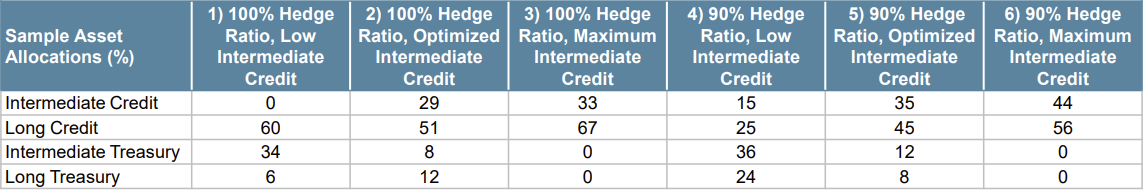
The liability profile of our Average Plan better lent itself to creating a diverse set of allocations that allowed us to toggle asset allocation variables including Credit exposure and duration. We ran a total of six sample allocations. Sample Allocations 2 and 5 sought to optimize the Intermediate Credit allocation that would minimize tracking error with liabilities.
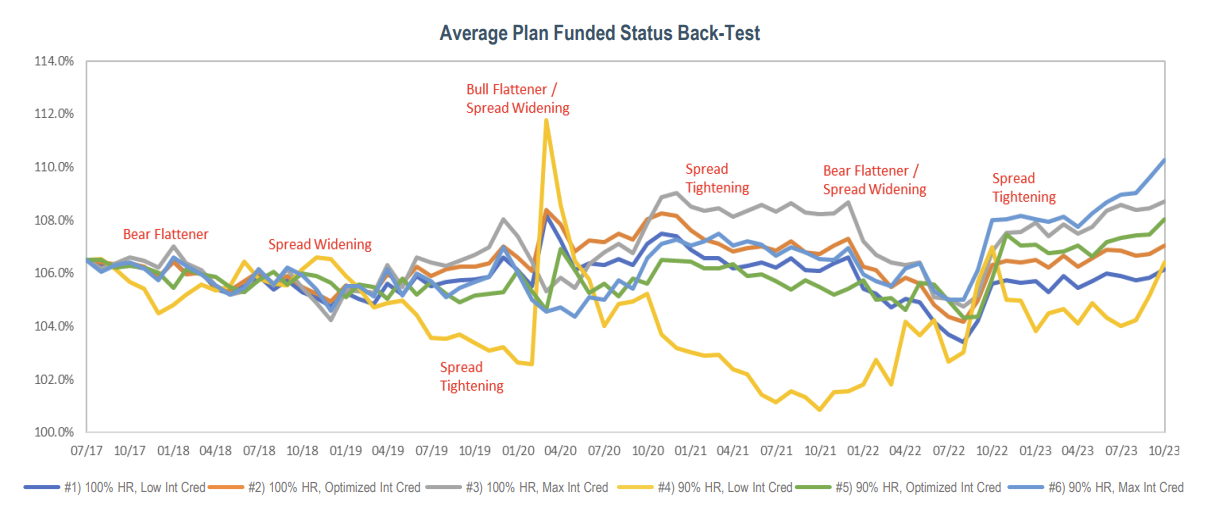
Higher allocations to Intermediate Credit performed best in our 5-year back-tested scenarios. In running the back-test, we saw that the scenarios with the largest funded status improvement over a 5-year time horizon also had the highest Intermediate Credit allocations. This did come at the expense of drawdown risk in spread widening environments. Interestingly, reducing hedge ratio by 10% did not appear to have a significant correlation to funded status drawdown risk.
Intermediate Credit is anticipated to outperform Long Credit on a forward-looking basis. Our 10-year forward-looking simulations showed that the asset-liability tracking error was higher over the long-term for Intermediate Credit than Long Credit. However, the dispersion in results skews positive for Intermediate Credit with greater funded status improvement over a 10-year period than Long Credit. This is driven by the anticipated mean reversion resulting in Long Credit spread widening and yield curve steepenin
Risk and return may be improved by including a tactical allocation to Intermediate Credit for our Average Plan. The current spread and yield levels for Intermediate Credit look relatively more attractive than Long Credit. However, the carry advantage will diminish as we revert to normal market conditions.
Mature Plan
Given the shorter liability duration of our Mature Plan, we were able to create scenarios with meaningful allocations to Intermediate Credit while still maintaining our target hedge ratios.
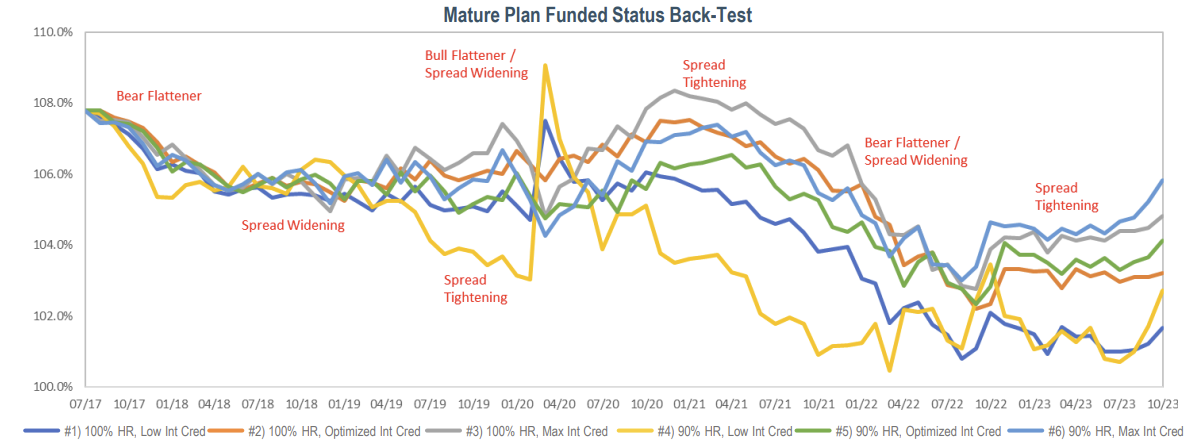
Low Intermediate Credit allocations resulted in higher drawdown risk over our 5-year back-test. The late 2017 yield curve flattening weighed on all scenarios, resulting in a decrease in funded status over the period. Scenarios with the smallest allocations to Intermediate Credit fared the worst as they missed out on gains when curves steepened. Again, a 10% deviation in target hedge ratios did not significantly impact funded status performance.
Intermediate Credit experiences greater excess returns versus liabilities in forward-looking projections. Consistent with the Average Plan, our Mature Plan experienced greater asset-liability tracking error with Intermediate Credit than Long Credit, but this was biased to the upside. Funded statuses experienced more downside risk with Long Credit than Intermediate Credit on the premise of mean-reverting capital market assumptions.
A Mature Plan may benefit from a strategic allocation to Intermediate Credit. A mature plan’s liability profile is generally better suited for inserting a strategic Intermediate Credit allocation while retaining target hedge ratios. Intermediate Credit can offset the need for short Treasuries and is more aligned with the high-quality corporate discount rate basis of liabilities. The greater likelihood for future positive excess returns compared to Long Credit provide an opportunity to further protect funded statuses.
Intermediate Credit may be a compelling add to your investment strategy given its current carry advantage, diversification benefits, and the ability to limit its impact to funded status volatility. At IR+M, we recognize that each plan’s unique objectives, asset allocations, and liability profiles should be factored into investment decisions. We would welcome the opportunity to discuss our capabilities and customize the above analysis for your plan in your evaluation of whether an Intermediate Credit allocation can add value to your LDI strategy.
Methodology and Assumptions
As of 10/31/2023. The 5-year back-testing assumes a static liability profile (i.e., plans do not age) and is gross of fees. All simulated indices for back-testing are Bloomberg indices. Asset carry described above is annualized and calculated as the sum of yield-to-worst, convexity benefit (i.e., implied annualized volatility estimate of the price benefit), and roll-down (i.e., the annualized one-month estimate based on the current curve shape).
Forward-looking projections are sourced from Moody’s PFaroe. Long and Intermediate Credit asset classes are proprietary indices created and maintained by Moody’s PFaroe.
Moody’s Analytics PFaroe® product used by IR+M includes market data and other information sourced from third parties under license. Certain licensors require Moody’s Analytics to make disclosures to, or to obtain acknowledgements or agreements from, IR+M and parties receiving the information from IR+M, which is effected by the disclosures and disclaimers available at:
https://static.pfaroe.com/DisclosuresAndDisclaimers/index.html.
The IR+M Young, Average, and Mature Plans are sample plans created for illustrative purposes only. They are intended to represent typical US corporate defined benefit plans and serve as a guidepost so individual sponsors can assess reasonable changes for their own plans. The data neither represents trading nor reflects the impact that economic market factors might have had on the management of an actual portfolio. This is not a recommendation to purchase or sell any specific security. Actual results may differ. For more information on IR+M’s Young, Average, and Mature Plans please refer to the IR+M Funded Status Monitor Assumptions linked at the end of this presentation.
Detailed methodology and assumptions for the IR+M Young, Average, Mature Plans can be found at:
https://www.incomeresearch.com/wp-content/uploads/IRM-Funded-Status-Monitor-Whitepaper-2023.pdf
The views contained in this report are those of Income Research & Management (“IR+M”) and are based on information obtained by IR+M from sources that are believed to be reliable but IR+M makes no guarantee as to the accuracy or completeness of the underlying third-party data used to form IR+M’s views and opinions. This report is for informational purposes only and is not intended to provide specific advice, recommendations, or projected returns for any particular IR+M product. Investing in securities involves risk of loss that clients should be prepared to bear. More specifically, investing in the bond market is subject to certain risks including but not limited to market, interest rate, credit, call or prepayment, extension, issuer, and inflation risk.
It should not be assumed that the yields or any other data presented exist today or will in the future. Past performance is not a guarantee of future results and current and future portfolio holdings are subject to risk. Securities listed in this presentation are for illustrative purposes only and are not a recommendation to purchase or sell any of the securities listed. Forward looking analyses are based on assumptions and may change. It should not be assumed that recommendations made in the future will be profitable or will equal the performance of the securities listed. Some statistics require assumptions for calculations which can be disclosed upon request.
Copyright © 2023, S&P Global Market Intelligence. Reproduction of any information, data or material, including ratings (“Content”) in any form is prohibited except with the prior written permission of the relevant party. Such party, its affiliates and suppliers (“Content Providers”) do not guarantee the accuracy, adequacy, completeness, timeliness or availability of any Content and are not responsible for any errors or omissions (negligent or otherwise), regardless of the cause, or for the results obtained from the use of such Content. In no event shall Content Providers be liable for any damages, costs, expenses, legal fees, or losses (including lost income or lost profit and opportunity costs) in connection with any use of the Content. A reference to a particular investment or security, a rating or any observation concerning an investment that is part of the Content is not a recommendation to buy, sell or hold such investment or security, does not address the suitability of an investment or security and should not be relied on as investment advice. Credit ratings are statements of opinions and are not statements of fact.
“Bloomberg®” and Bloomberg Indices are service marks of Bloomberg Finance L.P. and its affiliates, including Bloomberg Index Services Limited (“BISL”), the administrator of the index (collectively, “Bloomberg”) and have been licensed for use for certain purposes by IR+M. Bloomberg is not affiliated with IR+M, and Bloomberg does not approve, endorse, review, or recommend the products described herein. Bloomberg does not guarantee the timeliness, accurateness, or completeness of any data or information relating to any IR+M product.
IR+M claims compliance with the CFA Institute Asset Manager Code of Professional Conduct. This claim has not been verified by the CFA Institute.
This material may not be reproduced in any form or referred to in any other publication without express written permission from IR+M.
Sample Portfolios:
All sample portfolios are represented as of the aforementioned dates. There are limitations in sample results, including the fact that such results neither represent trading nor reflect the impact that economic market factors might have had on the management of the account if the adviser had been managing an actual clients money. Actual results may differ. A similar analysis can be provided of any portfolio we manage.
Moody’s Analytics PFaroe® product used by IR+M includes market data and other information sourced from third parties under license. Certain licensors require Moody’s Analytics to make disclosures to, or to obtain acknowledgements or agreements from, IR+M and parties receiving the information from IR+M, which is effected by the disclosures and disclaimers available at:
https://static.pfaroe.com/DisclosuresAndDisclaimers/index.html.