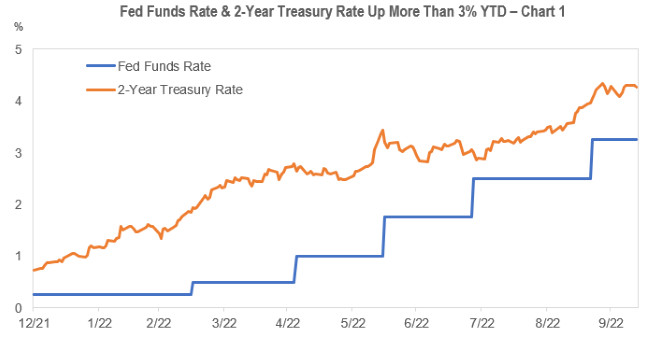
What a difference (almost) a year makes… At the end of 2021, short cash and bond yields were the subject of little fanfare. The Federal Reserve was targeting a fed funds upper band of 0%-0.25%, the 2-year Treasury was yielding 0.73%, and 1-3 year corporates were at 1.12%. Fast forward to today, and after five hikes totaling 300bps, the fed funds rate is hovering at 3.25%, the 2-year Treasury is exceeding 4.25% in anticipation of further rate increases, and 1-3-year corporates are nearly 5.4%…
WHAT GOES AROUND, COMES BACK AROUND
As with bellbottoms and platform shoes, cash alternatives are now in vogue due to the sharp rise in short-term rates. Products that are focused on the front-end of the curve, such as extended cash or 1-3-year strategies, may offer investors a low-risk means of capitalizing on opportunities caused by market volatility.
We believe that there is significant value to be had for investors willing to look beyond the traditional cash investments of money market funds, bank deposit accounts, and short Treasury bills. Investors who are amenable to the two to three-year maturity range may be rewarded with slightly higher rates versus current cash equivalents and repos of 3% to 3.5%. These levels are driven by the current fed funds target and market expectations that fed funds will continue to rise until peaking at 4.6%-4.7% in March 2023.
IN THE SHORT TERM
Historically, in rapidly evolving markets, money market fund yields typically lag, which makes the case for extended cash and 1–3-year offerings even more compelling. With yields up approximately 500bps since year end, and forward rates pricing in relatively stable rates for the next two years, we believe that cash alternatives are a worthwhile consideration right now. Whether to mitigate portfolio volatility, de-risk, or generate income, extended cash might be like slipping into that old pair of bellbottom jeans in the back of your closet.
MARKET UPDATE – SHORT DURATION
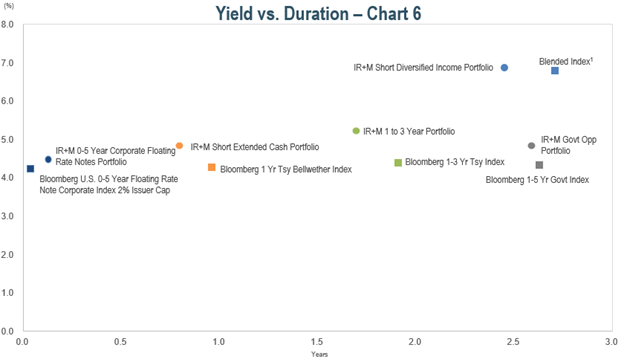
IR+M – REPRESENTATIVE SHORT-TERM PRODUCTS