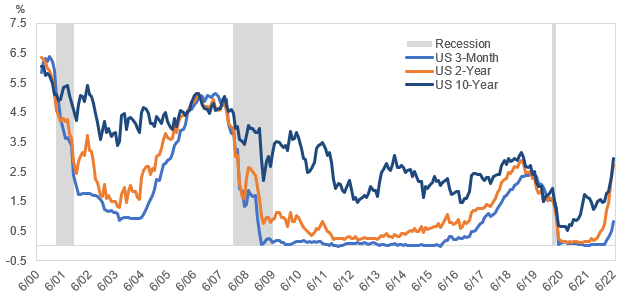
Market pundits will tell you that an inverted Treasury yield curve is a precursor to a recession. There have only been 3 recessions in the past 30 years: March 2001 – November 2001, December 2007 – June 2009, and February 2020 – April 2020. The 2-year/10-year Treasury relationship inverted prior to all three of these cases, 15, 18, and 6 months prior to the onset of the downturn. We had a brief inversion in April, and currently stand within a 18bp inversion as of this writing.
Chart 1: Inverted Treasury Yield Curve a Precursor to a Recession?

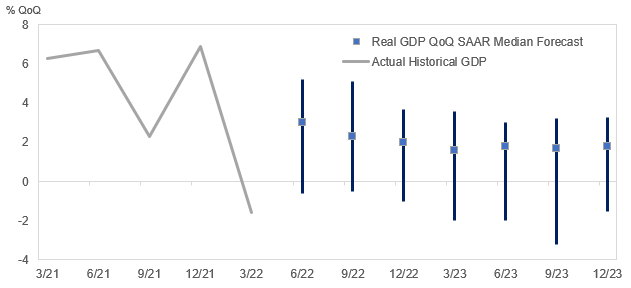
What does that portend for the economy? A recession is generally defined by the National Bureau of Economic Research (NBER) as a significant decline in economic activity that is spread across the economy and lasts for more than a few months. They evaluate the depth, diffusion, and duration of the decline in activity, and each needs to be met to some degree. However, in cases like 2020, the depth and diffusion were so great that they outweighed the brief duration. More broadly speaking, market participants can be heard defining a recession as two consecutive quarters of declining GDP. For the first quarter of 2022, real GDP was -1.6% measured quarter over quarter at a seasonally adjusted annual rate (QoQ% SAAR). As of July 15, the Atlanta Fed GDP Now forecasting model puts the second quarter at -1.5% QoQ SAAR. If that comes to pass, we technically had a recession in the first half of 2022, which may be continuing now. However, the range of outcomes is quite broad as evidenced by the 60 economists surveyed by Bloomberg with Q2 estimates ranging from -0.6% to 5.2%. In any case, the curve inversion is indicating an upcoming soft patch.
Chart 2: GDP Declines and Estimates Vary

How is curve inversion tied to the real economy? The last 3 recessions were largely caused by different factors – the dot com bust in 2001, the financial crisis in 2008, and Covid in 2020, but they all had a yield curve inversion several months prior in common. Typically, the Fed begins raising rates to temper inflation by reducing GDP growth, without causing undue harm to the economy. The Fed controls short-term rates via setting the upper and lower band for the Fed Funds rate and can also purchase securities on the open market as they have in past years during quantitative easing (QE). Today, the Fed is in the process of raising the Fed Funds rate and allowing their Treasury and mortgage-backed securities (MBS) holdings to roll off by not reinvesting proceeds, the latter being quantitative tightening (QT). Currently, the economic slowdown is being driven by lower government spending, the increased trade deficit, and less inventory investment. Inflation is rampant due to supply chain disruption, energy pricing, and higher borrowing employment costs. In addition, there is the significant decline in the stock market, reducing the wealth effect and affecting consumption. While pent-up pandemic saving can continue to support consumption, consumer confidence and sentiment are declining. It’s interesting that in this downturn, unemployment is relatively steady at a mere 3.6%, and the economy is still creating jobs – there are almost 2 jobs for every one person that is looking for one. On the contrary, we are starting to see a few headlines regarding layoffs: Tesla, Netflix, JP Morgan, ReMax, Coinbase. And, with the latest inflation reading running at 9.1%, the Fed is raising rates in an attempt to reduce the demand side. This may prove challenging as many of the factors pushing inflation higher are supply-side based. For example, the Fed can’t produce more oil and gas, but we have seen energy prices and other commodity markets roll over.
As the Fed raises short-term rates, longer Treasury rates tend to rise less, creating the flatter or inverted Treasury yield curve we are seeing today. The 10-year minus 2-year difference (the 2/10 spread) was about 115bps a year ago, close to the 110bp average over the past 30 years, while it currently stands at -18bps. The 2-year Treasury anticipates where the Fed is going, in theory, pricing out an equivalent return profile between rolling short paper and buying the 2-year over the next 2 years. The 2-year Treasury typically moves ahead of the Fed; the 3-month/10-year Treasury is still at about a 49bp spread since the Fed is still moving short rates more slowly. The 3-month/10-year Treasury spread is often considered a more reliable indicator of an upcoming recession, with a lead time of about 12 months; the forward curve now implies an inverted 3-month/10-year curve within 6 weeks.
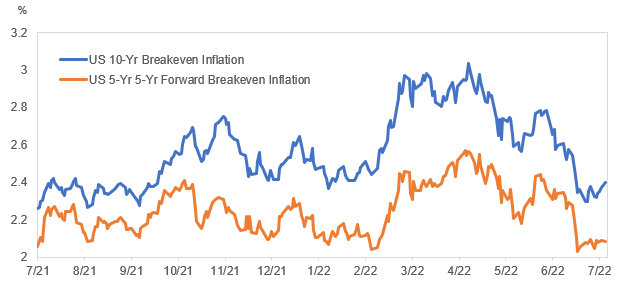
So why do long rates rise less? The longer end of the Treasury market is always worried about inflation eroding its total return so tends to trade based on expected inflation. If the Fed is doing its job, long rates don’t need to rise as far, assuming the Fed will get inflation under control. In fact, the market is pricing in that the Fed will succeed, as indicated by the breakeven on 10-year TIPS having fallen over 66bps from its April peak. Likewise, the 5-year/5-year forward breakeven, which is often one of the market’s favorite metrics for intermediate-term inflation, is 51bps lower than its recent high reached in April. These shifts lower highlight the market’s belief that there is a temporary element to the persistently high level of inflation we are seeing now – the market believes the Fed does, or will, have inflation under control, and that we are just going through a rough patch.
Chart 3: The Market Believes the Fed Will Have Inflation Under Control

As the Fed raises rates, economic growth will slow. As a result of slower growth expectations, we have seen wider spreads for corporate bonds and flatter credit curves (credit curves indicate the spread over Treasuries for various corporate bond maturities). Securitized issues have also widened in sympathy. Ultimately, the depth and length of the slowdown will help determine the extent of the widening, but these periods can create opportunity to add solid, high-quality companies and securitized issues at attractive valuations. Liquidity can also deteriorate in times of market dislocation, so it is important to have sufficient dry powder to take advantage of sellers in a buyers’ market, as one can be well compensated to be a provider of liquidity.


