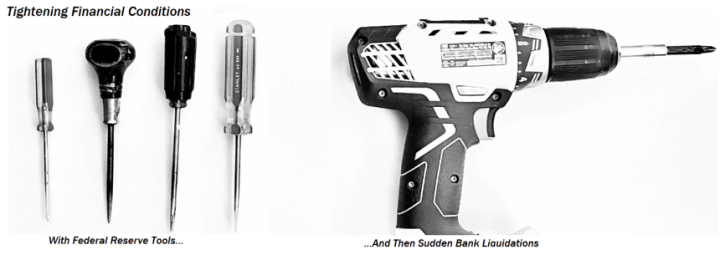
It’s amazing that the Federal Reserve (Fed) kicked-off this unprecedented tightening cycle with an initial 25bp rate hike only 12 months ago. Since then, they have meticulously pondered each turn of the screw against a plethora of slowing economic data. Then came the ghosts of the Great Financial Crisis (GFC). For the past 10 days, we have watched sudden bank runs, massive government backstops, and hasty rescue packages emerge from the 24/7 headlines around the globe. It culminated, at least for now, with this weekend’s announcement of the biggest bank rescue package since 2008– a $3.25bn forced marriage between UBS and Credit Suisse.
This can’t be what the Fed had envisioned as a capstone flourish to its tightening campaign, can it? Well, that is very well what we may have just witnessed. Sure, the Fed may carry through with one more 25bp hike on Wednesday, but the economic impact of this mess doesn’t look transitory to us. A crisis in U.S. bank confidence by both depositors and creditors will require major additional corrective actions by regulators and politicians to avoid the scary risks of deflationary contagion.
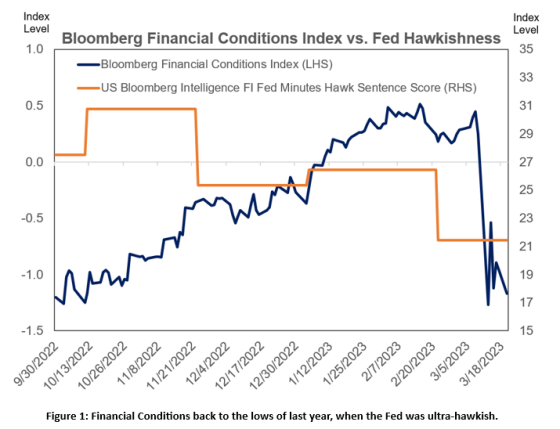
Figure 1 shows the real-time impact of the past 10-days on overall financial conditions. The collapse of Silicon Valley and Signature Banks along with the existential stress on Credit Suisse and First Republic has depressed overall financial conditions back to the level of peak Fed hawkishness in 2022, or just prior to the UK Pension and political crisis. Although that market crisis was smoothed over quickly, the pull-back on tightening by Central Banks around the world shortly thereafter was no coincidence. The Fed, the Bank of England, the European Central Bank, and the Bank of Japan place financial stability at the top of their multi-pronged mandates – above economic growth and price stability – especially when shadows of the 2008 crisis emerge.
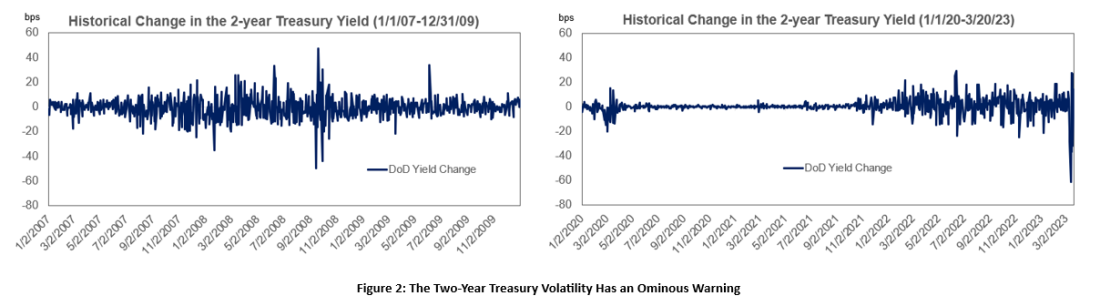
While we wait for Powell to do his best linguistic juggling act in front of the popular media on Wednesday afternoon, the 2-year Treasury is flashing ominous warning signs. Its recent run of yield volatility, including 7+ days of 20+bp moves (not to mention a 100+bp rally from its high of 5.07% on March 8th) implies that the hard vs. soft landing debate will return to the forefront of investors’ psyches. Front-end yield curve volatility now exceeds that during the Covid Crisis and threatens to rival that found at the depths of GFC (Figure 2). Although today’s banking woes are nowhere near those in 2008, the economic ramifications of this situation has its own unique caveats. Topping that list is the notion that the Fed and Congress now have limited means to provide additional rescue stimulus given the political environment and inflationary consequences.
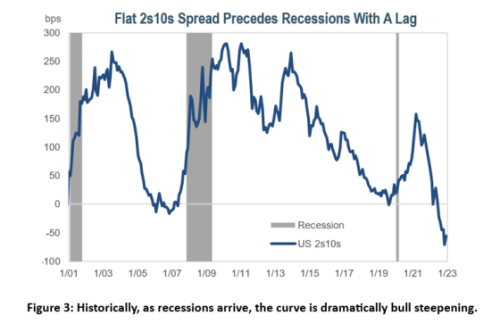
Perhaps the most notable signal emanating from the Treasury market is the correction in the level of the 2-year/10-year inversion. This recession indicator hit a low of -110bps on March 7th and has now steepened back to -50bps as of this writing. While that sounds like a vote of confidence in our economic future, it’s important to understand how inversions have historically corrected through the economic cycle. Typically, a 2-10’s inversion reverts via a powerful bull steepener (front-end of the yield curve falling faster than the long end) right before a recession hits. Figure 3 shows that to be the case in each of the last three recessions.
The recession chatter prior to the bout of strong January economic data was centered on the probability of a soft vs. hard landing in the second half of 2023. Now that the market-economic feedback loop is accelerating, it is pulling forward once distant outcomes into the realm of possibilities for the second quarter. If broad stress on bank credit and deposit conditions continues to plague the financial sector, contagion will quickly spread to corporate and main street America.
Tighter financial conditions are, in effect, the invisible hand of real economic activity. That hand is clenching a bit harder this morning. The risk premium embedded in mortgage and commercial real estate rates, the stipulations applied to business loans, and the fees/limits attached to credit card balances are all frictions which can rise as banks and regulators sort this out. If this does push us towards the hard landing scenario, history may well remember the “Silicon Valley Bank Collapse” as the watershed event marking the beginning of the 2023 Recession.
Despite the rally, investors still have an opportunity to park dry powder in high-quality bonds. Real yields are still positive. The Fed Funds Futures market implies a mere 3 cuts by the end of the year. The conviction that we are headed for a recession is simply not baked into the price you pay for bonds today. And, in the event that we avoid recession, the downside for rates seems more and more like the Fed stays parked near 5% for a prolonged period rather than continuing to hike to, and perhaps beyond, 6%.
This type of bimodal economic outcome points to liquid, high-quality bonds as a critical component in broad asset allocation. The usefulness of modeled GDP forecasts, optimized efficient frontiers, and projected asset return ranges should be heavily discounted for the time-being. Economic and investment return outcomes are not set up to be normally distributed right now. Rather, tails are fattening with confidence and sentiment in the driver’s seat. The Treasury market volatility is telling us that loud and clear.