
On March 23rd 2020, a buyer with extremely deep pockets stepped in to support the weakened US corporate bond market. That buyer was the United States Department of the Treasury, using capital earmarked via the CARES act. Authorized to deploy $75B, which could be levered 10x by the Federal Reserve, the Treasury/Fed announced two corporate bond buying facilities (PMCCF and SMCCF) with $750B in potential purchasing power.
The market responded just like you would have expected. Big, big rally. “Tourist” buyers from other asset classes, foreign buyers, mutual funds, and asset managers alike dove in head first to buy a market that was all but “guaranteed” by the dual forces of the Treasury and the Fed.
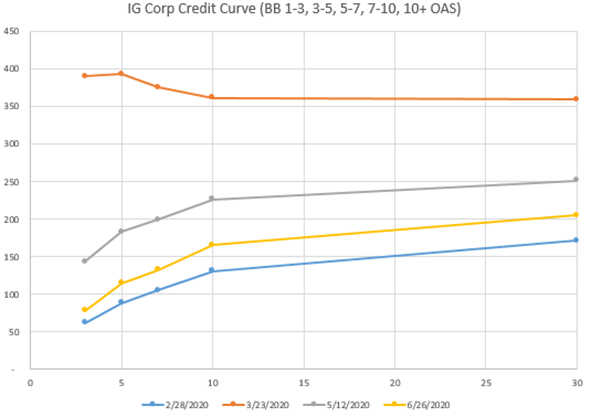
The chart below shows the play by play:
2/28/20: Pre-covid, “normal”, corporate spreads: low with a typical ascending credit curve (blue). We thought the market was overpriced here given underlying fundamentals.
3/23/20: Not a month later. Peak COVID panic (orange). Corporate bond, ABS, CMBS, Muni, TIPS, Off The Run Treasuries all experience severely diminished liquidity. Transaction costs increase. Credit fears up. Spreads widen. This is the day the Treasury and Fed came to the rescue.
5/12/20: SMCCF starts buying. Spreads have already rallied in anticipation of buying. (grey)
6/26/20: Though a little volatile of late, spreads continue to rally through May and much of June. (yellow)
So that’s it? Problem solved? Spreads will never go wider again? Not so fast. The details are that the Tsy/Fed are predominately buying 5yr and in maturities (the exception being longer dated issues within ETFs) AND that corporate credit fundamentals remain stretched. We are seeing both of these factors contribute to a material steepening of the credit curve.
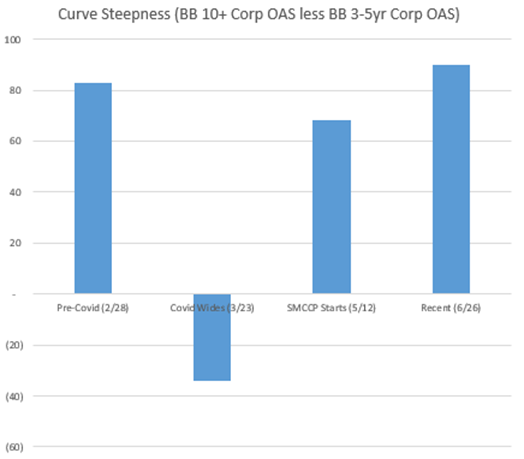
Generally, steep credit curves tell us that investors have certainty around front end maturities (require less spread compensation) but want to get paid more in spread to own longer maturities. Contrast that with flat/slightly inverted curve we saw in March which resulted from a quick and severe drop in dollar prices for ALL maturities. The steepness we see now reflects certainty (the Fed/Treasury backstop) in the front end but real credit concerns for long maturity paper. We can see why.
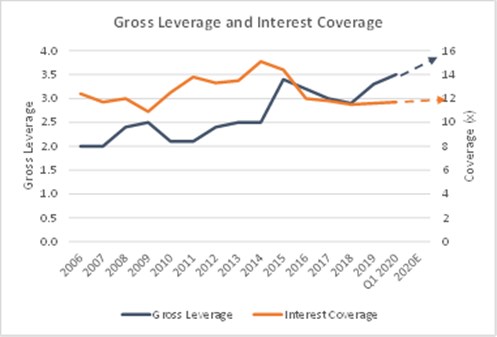
An examination of current credit fundamentals shows stretched leverage and coverage metrics for much of the broad industrials sector. It is well known that earnings will be extremely ugly in the coming quarters and this is likely in the price now. Longer term, can the credit universe de-lever from these secular highs? We cautiously think yes as we think issuers will work hard to avoid being downgraded to the un-backstopped high yield market. We also suspect lower leverage is and will continue to be rewarded in the equity market (see most of the QQQ constituents). In response, we are overweight a thoughtful selection of long maturity issues in our long duration mandates. Typically being overweight long duration credit at spreads of +200 or more results in handsome forward excess returns but it isn’t a layup. “Now more than ever” there will be highly differentiated returns among the long duration paper of investment grade issuers. We remain proponents of taking healthy risk but being fastidious around issuer and issue selection. Bottom up credit picking remains our key to success.
For the next few years it might very well be the shape of the curve and not the level of spreads overall that indicates the risk posture of the credit markets. We’ll be watching closely.