As the coronavirus spread and upended the world economy, businesses of all types were forced to temporarily shut down. The resulting loss of revenue has left many property tenants struggling to pay obligations to landlords, and a significant number of retailers declared bankruptcy. The $600 billion Commercial Mortgage-Backed Securities (CMBS) market encompasses many of the businesses most impacted, such as restaurants, office buildings, hotels and malls. Some investors are beginning to fear that losses may occur in their fixed income portfolios, but are such fears overblown? In this piece, we address the state of the CMBS market and detail our take on the sector.
STRESS CRACKS
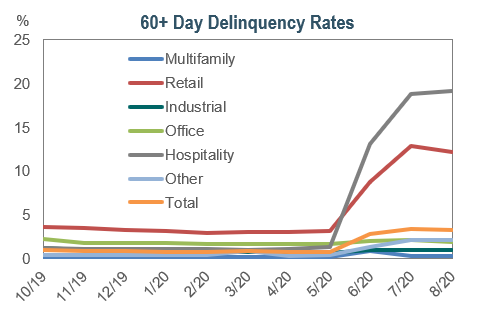
- With social distancing measures in place, commercial real estate (CRE) tenants across all business types have faced challenges in making their rent payments. In March, roughly 2% of CRE borrowers were 30-days late on their loan payments. This rate jumped to over 9% in August with some property types experiencing 30-day delinquency rates of more than 20%. The pace of delinquencies has surpassed that of the Great Financial Crisis (GFC), which comparatively took over a year to reach similar delinquency rates.
- As the pandemic drags on, many CRE borrowers are asking for a temporary pause on their loan payments, known as forbearance. Forbearance is typically granted for 3 to 6 months and the borrower is still obligated to make up those missed payments. In July, loans in forbearance reached over $17 billion. With so much uncertainty still looming, there is increasing fear that forbearance agreements will become foreclosures.
- However, peeling back the onion, the performance deterioration has not been homogenous across all property types as headlines might suggest. The hospitality and retail sectors have shown the largest stress cracks with 60+ day delinquency rates surpassing 19% and 12%, respectively.
- There are also segments that have seen minimal performance deterioration. For example, most office-based businesses have remained operational, and subsequently current on their rent payments. In addition, due to the longer-term tenure of office space leases, bond investors are further protected from potential structural shifts (such as a portion of the workforce permanently working-from-home).
RESPECT THE SENIORITY
- The majority of CMBS trusts originated post-GFC have included senior tranches that are structured with a minimum subordination of 30%. This protection is in addition to the underlying borrower’s equity, which exists outside of the trusts, and it absorbs any losses prior to bondholders in a property liquidation scenario. Additionally, the amount of credit enhancement for senior tranches can also increase over time as principal payments are made.
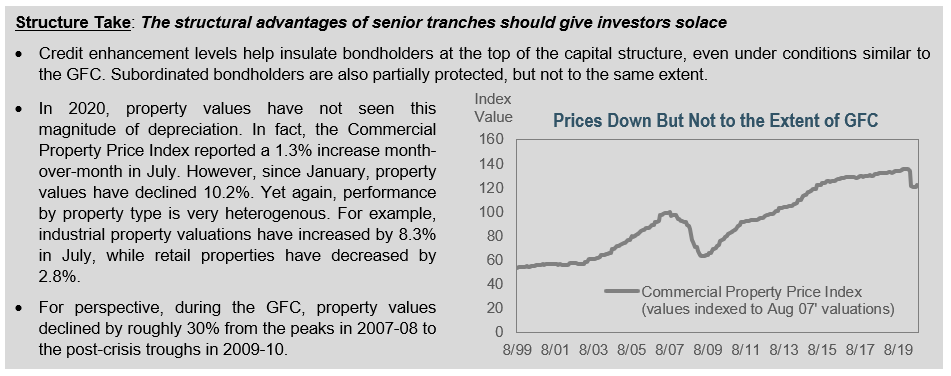
- To illustrate the protections supporting bondholders, we highlight the impact of three property devaluation scenarios on the senior tranches of a CMBS trust. For the purpose of this exercise, the trust is made up of one loan – which was originated with a loan-to-value of 60%. We assume that national commercial property valuations fall by 30% (similar to the GFC), 60% (twice the GFC) and the mid-point of 45%. The underlying trust property is liquidated under each scenario.
- In this example, senior tranches are fully insulated from principal losses as long as property values decline by less than 60%, a scenario that is not currently predicted by analysts.Principal payments flow to senior debtholders first, while losses flow to the equity and subordinated tranches first. When the proportion of senior-to-subordinated tranches decreases, the credit enhancement subsequently increases.

LOOKING BACK
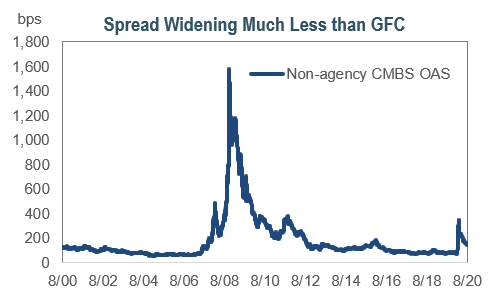
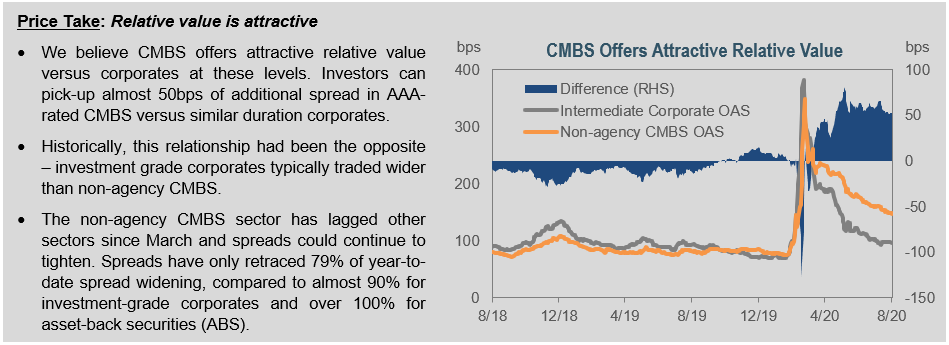
- In sympathy with the rest of the investment-grade market, CMBS spreads reached their widest levels in over 9 years back in March. The Bloomberg Barclays Non-Agency CMBS Index started the year trading below 100bps, but quickly widened to almost 365bps. Spreads eventually retraced much of the spread widening and settled closer to 150bps, as market action via TALF 2.0 helped calm investor fears and supported spreads.
- Spreads have not reached the same distressed levels that investors experienced during the GFC, despite some headlines suggesting negative long-term structural changes. During the crisis, non-agency CMBS spreads widened by over 1,400bps and reached almost 1,600bps.
The impact of the pandemic is undoubtably being felt across the CMBS market; and now more than ever, we feel that it is important for investors to understand the potential downside amid uncertain times. Despite the present challenges, we believe that CMBS still has a place within investment-grade fixed income portfolios and investors should be able navigate the current market environment.
At IR+M, we rely on our bottom-up security selection skills to continually assess the sector. We prefer to invest at the top of the capital structure across diversified collateral types with healthy levels of credit enhancement. We believe that the structural advantages should insulate investors from broad weakness, while offering attractive relative value to investment-grade corporates.