In our annual analysis of insurance company filings, we examine trends and changes that occurred in fixed income portfolios during the course of 2019. Although overall portfolio allocations were relatively stable, we saw a continuation of some trends identified last year, including a decrease in municipal allocations. Given the current elevated downgrade risk, we also look at fallen angels and the potential impact to NAIC 3 exposure.
2019 Allocations in Review

- Though it may seem like the distant past, 2019 was a good year for insurance company investment portfolios. Strong equity and fixed income returns led unrealized gains to increase at record levels.
- Despite the prolonged low interest rate environment, Net Investment Income (NII) was fairly stable year-over-year.
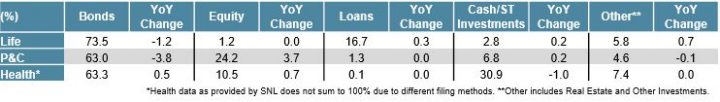
- As is typical, overall asset allocation moves across insurance company types were small and primarily on the margin.
- Equity allocations, particularly within P&C insurers, ended the year at their highest levels, while bonds were at their lowest. This positioning likely benefited results in 2019, but may have decreased asset values in the first quarter of 2020.
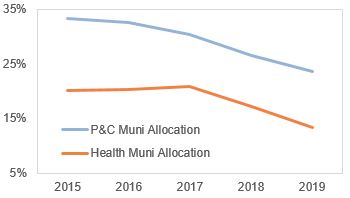
- P&C and Health insurers reduced their allocations to municipal bonds, a continuing theme since the passage of the Tax Cuts and Jobs Act (TCJA) in 2018, which made municipal bonds less attractive relative to taxable bonds at the 21% corporate tax rate.
- However, we feel it is important that portfolios retain the flexibility to be opportunistic. The 10-year muni/Treasury ratio reached record highs of over 350% in March during the market volatility, presenting an attractive relative value opportunity to selectively add back to the sector, even with a 21% tax rate.
Fixed Income Ratings Observations
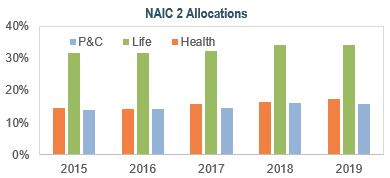
- Despite relatively stable allocations to NAIC 2 rated securities in 2019, the growth in both the overall BBB market and exposure to BBBs on insurance company’s balance sheets continues to draw headlines.
- While an important source of yield, these allocations should be monitored closely, given the elevated risk of downgrades. Approximately 9% of the IG universe has been downgraded this year, with more expected.
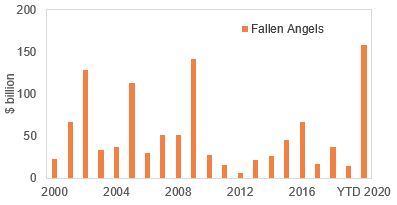
- There have been over $150 billion of Fallen Angels (investment-grade bonds that have been downgraded to high-yield) year-to-date, more than any full year period in the last two decades. Most estimates call for $250 – $350 billion by year-end, with some predicting $500 billion or more.
- Collateralized Loan Obligations (CLOs) are also a candidate for downgrades. Moody’s put over 800 CLOs on downgrade review in April, and S&P placed over 150 US CLO tranches on watch. Although most of the tranches are below IG, this effects approximately 30-50% of the BBB-rated CLO universe.
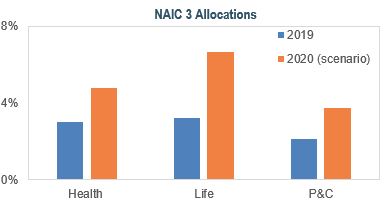
- These downgrades have the potential to impact insurance company investment portfolios. For example, the amount of Fallen Angels in 2020 could easily exceed 10% of the current universe of BBB-rated corporate bonds.
- If insurance companies were to experience a similar level of downgrades in NAIC 2 assets, NAIC 3 allocations could increase substantially assuming insurers don’t sell pre- or post-downgrade. This might present concerns with rating agencies and lead to additional RBC charges.
Managing Liquidity and FHLB Usage
- Insurers face a number of potential liquidity headwinds as a result of the current crisis. For example, health insurers are challenged by additional claims, reduced premiums, and a potential backlog created by the deferral of elective procedures. Some P&C insurers face potential pressure from event cancellation and business interruption polices.
- While some insurers have been harvesting income and raising cash, another option that may help address liquidity needs is the Federal Home Loan Bank (FHLB).
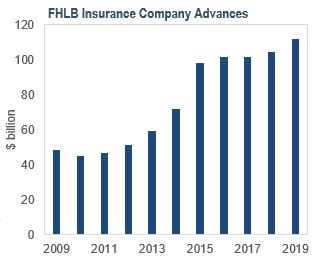
- Advances to insurance companies from the FHLB have more than doubled over the last 10 years to over $100 billion last year. Insurance companies can use advances from the FHLB as a ready source of liquidity to augment lower investment yields, and mitigate the need to sell securities at a loss or miss out on investing opportunities when cash is low.
While volatility is likely to persist for the near future, at IR+M we think this presents opportunities for insurance companies. We believe as credit allocations become more important with prolonged low interest rates, so does the need to focus on bottom-up security selection, particularly with increased downgrade concerns. Through our experience managing high quality fixed income portfolios and partnering with insurance clients, we think we are well-positioned to help fulfill investment needs during these challenging times.